|
Buoy 46006 located 650NM west of Eureka, CA and 1,234 miles S/SE of buoy 46001 in the Gulf of Alaska was analyzed for a rise in sea surface water temperature. Both buoy's are located in depths over 4km deep and monitor sea surface temperature 1m beneath the surface. The difference in the hour readings in the following graph is that 46006 reports in every 10 minutes, and 46001 reports in once an hour. We can see a rise in sea surface temperatures at buoy 46006 just after a week of the initial surge recorded on 46001. The second spike in the upper graph is the 7.9 earthquake, and I spiked the lower graph for visual perspective of time. This is evidence of geothermal heat being a major contributor to our oceans. This increased heat increases water vapor that accumulates into clouds and rain cooling the surface inland. This also demonstrates, through mass dissipation, that our oceans are natural chilling towers for a huge nuclear reactor that we call the "Core." This in turn becomes the major driving mechanism for cloud cover and precipitation that drives our climates. 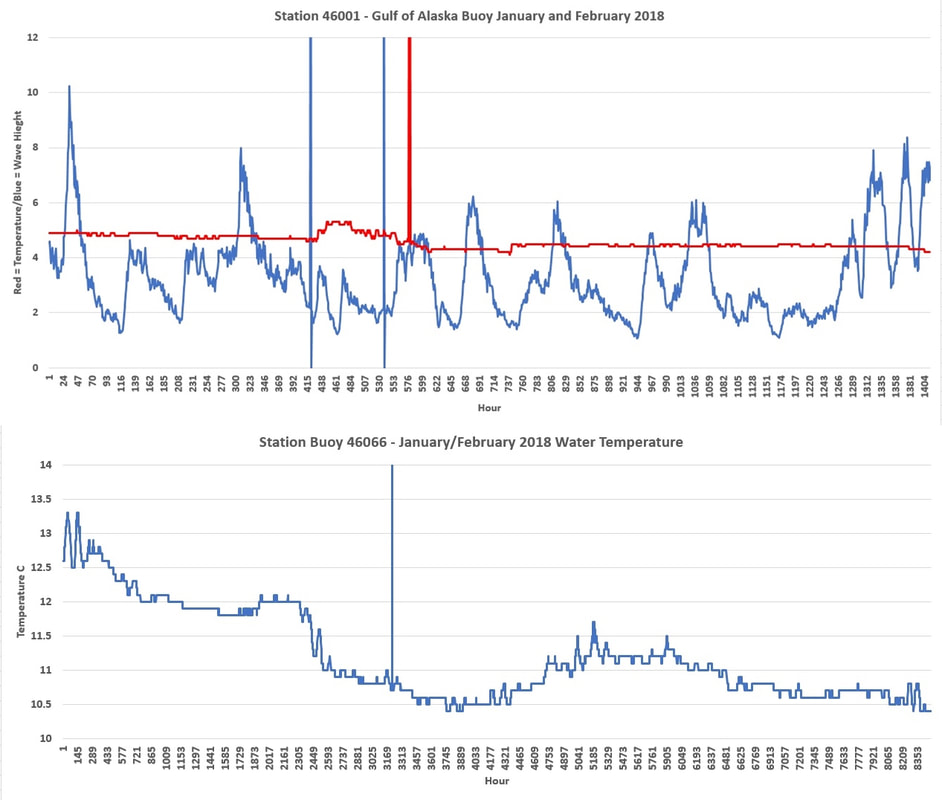
0 Comments
The activity in the Gulf of Alaska is not a typical volcano as we usually think of them. On January 3, 2018, a 3.2 earthquake struck this region at 7.5km. This buoy is 4km above the ocean floor. On January 18th, 2018, a 3.4 magnitude earthquake struck along the ocean floor at 4.7km and I identified this time with the first blue line. This earthquake opened up the ocean floor and allowed cold sea water and magma to interact and is displayed by the lower wave height and increased heat that followed. On January 23, 2018, less than 48 hours later, and is demonstrated by the second blue line, a large 7.9 magnitude struck due to the rising pressure that the incoming sea water was creating. We then observe the surface temperature spike and the wave heights increase less than 48 hours later. Researching this buoy demonstrated no alterations in temperatures of this magnitude in the historical records. 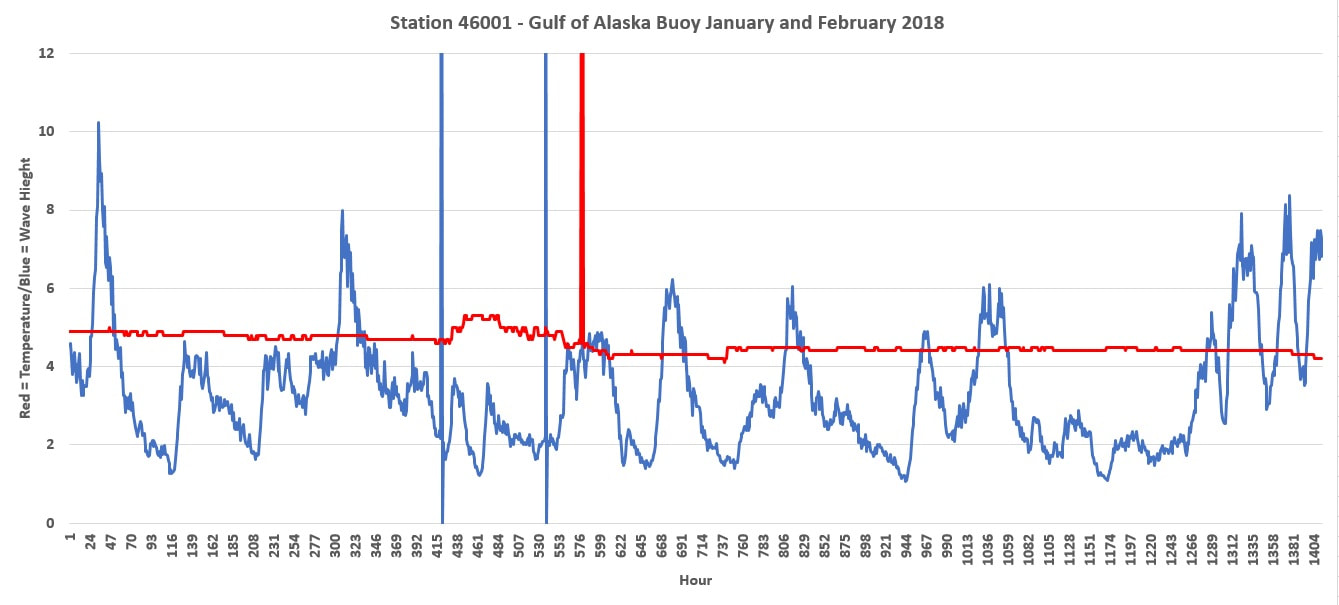 Searching Earthquakes 3.0 and greater, 36km maximum depth in this region of the Gulf of Alaska. There have been more 3.0 level earthquakes in this region in less than 3 months than has been experienced in 26 years. From 1970 to 1996 there were 2,084 earthquakes in this top image, in the bottom image we have had 2,090 since January 1. Prior to this year the maximum was 394 in 2012. 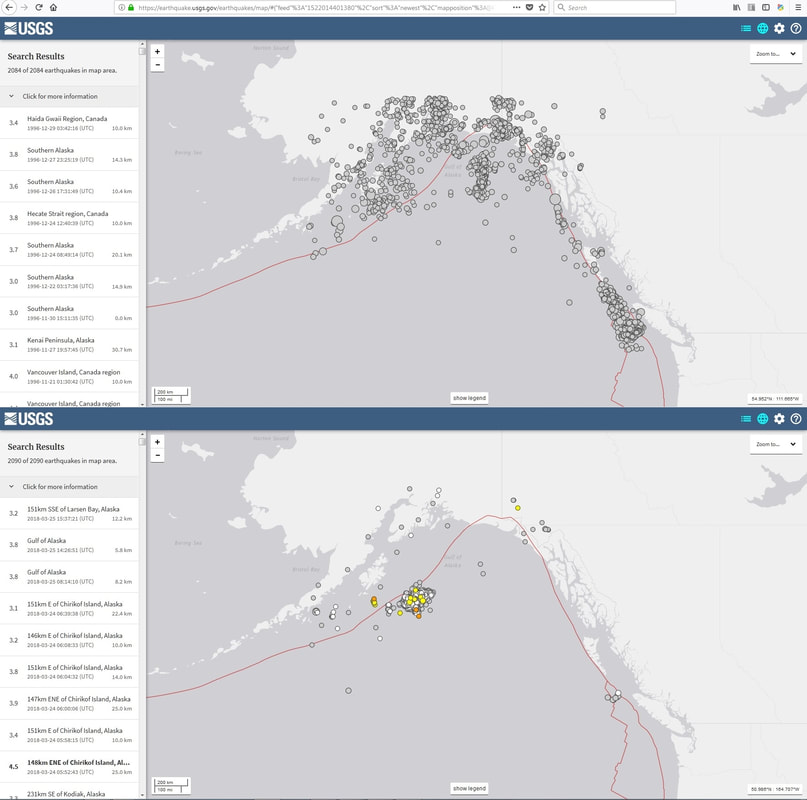 In the following image is the surface water temperatures in the Gulf of Alaska, all other buoys are demonstrating the same rise in surface water temperatures since 2012. This is also the same time frame when subterranean aquifers began pulsing heat into the territorial waters, a sign of the aquifers coming to thermal equilibrium with the bedrock. Now the seas are demonstrating the same rise. 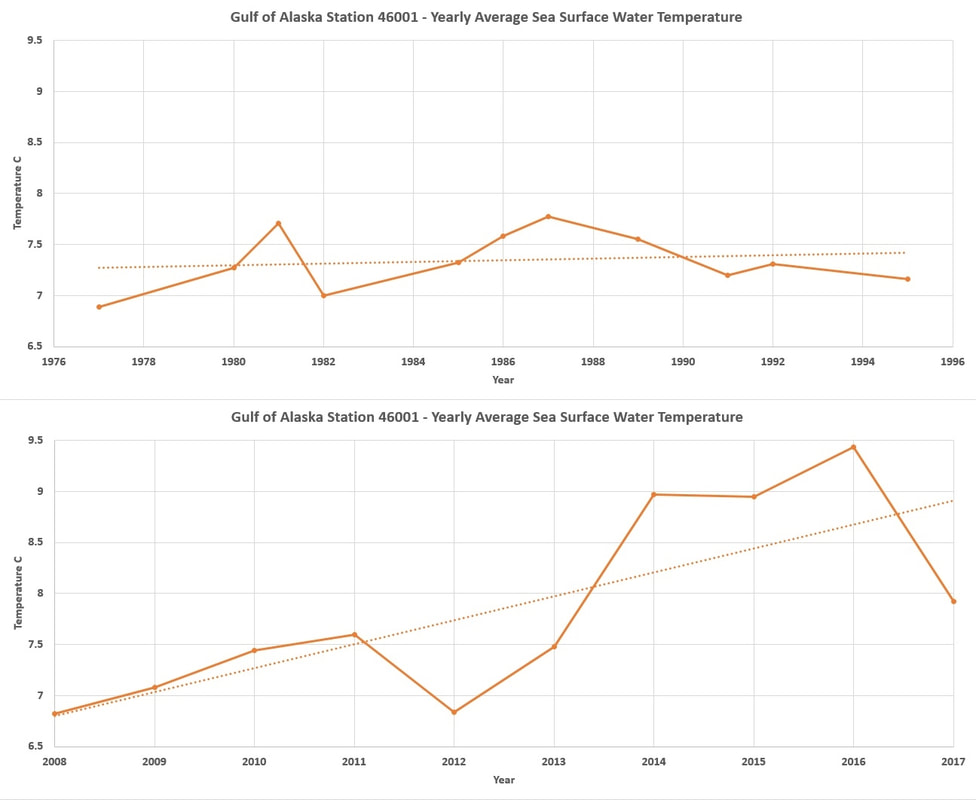 Researching Buoy archives has revealed a mass amount of understanding. For example, here is Station 44011 located out in the North Atlantic in the google map images. Using the historical data on this location reveals massive amounts of energy rising to the surface from geothermal sources when compared to 2017 and 2016. This energy will increase cloud cover and precipitation over Europe short term. http://www.ndbc.noaa.gov/ 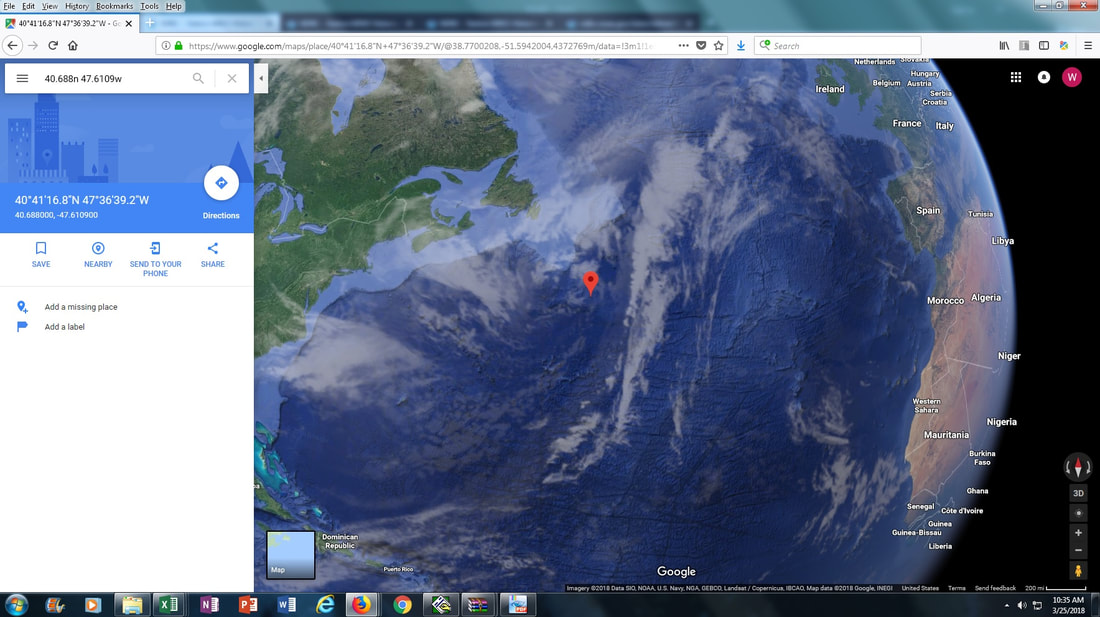 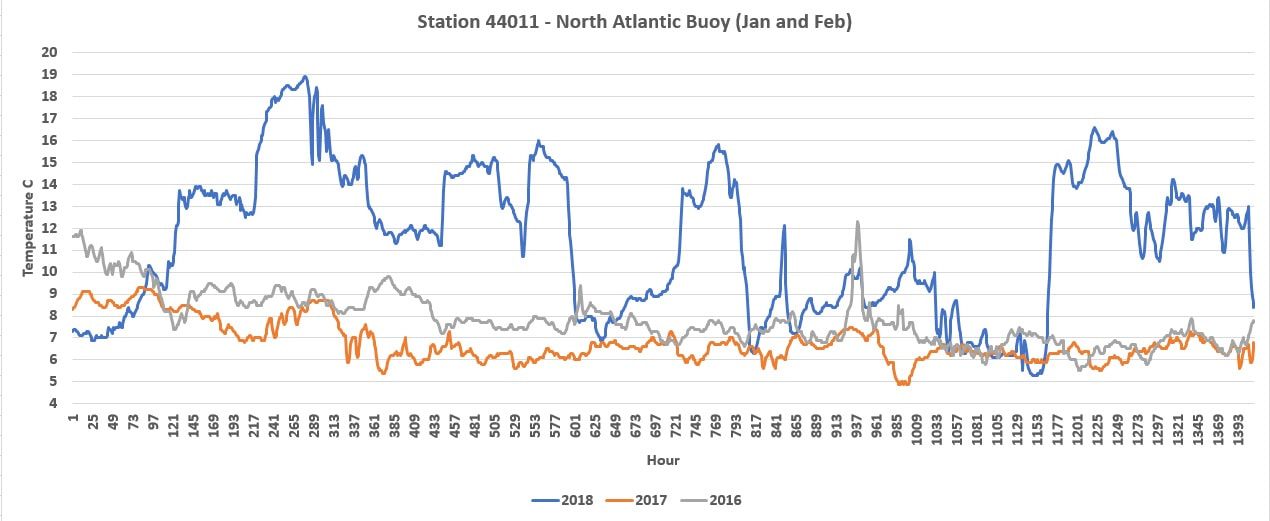 On January 23, 2018 a large 7.9 magnitude deep sea earthquake occurred. Since this time there has been numerous earthquakes in the region. Because volcanic eruptions are associated with these events and the increase in activity in this region, further research was obtained. 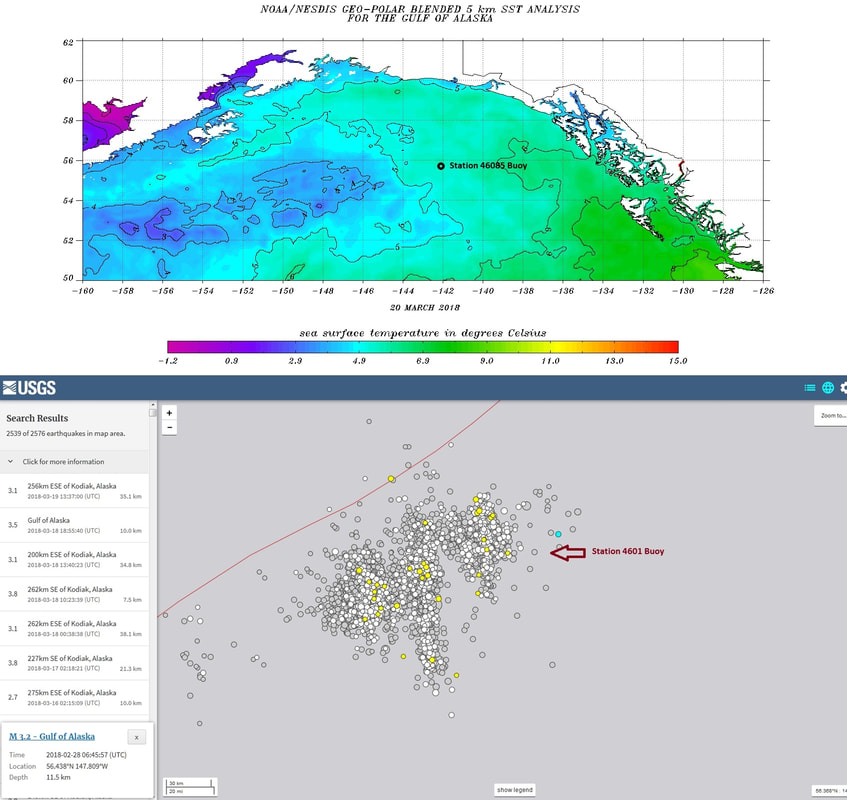 The NOAA National Buoy Center had station 46001 buoy nearly directly above this location and on January 25th the temperatures rose for more than 2 hours reaching 15.5C, 60F above normal. Another buoy, station 46085, demonstrates a continual resistance to cooling maintaining a temperature nearly 1C above last years average. 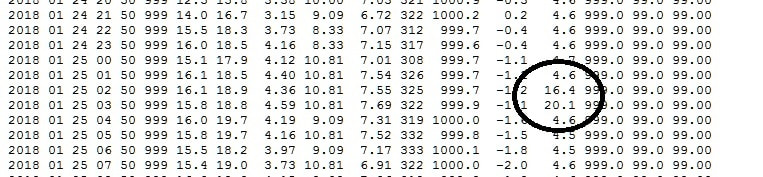 Water will naturally evaporate at a greater rate when warmed, and this has increased the water vapor and clouds in the atmosphere resulting in surface cooling and a rise in precipitation. The jet streams then move this across the continental plate. As the spring melt occurs we will see a rise in flooding as this snow pack along these routes melts releasing even more water vapor into the atmosphere.
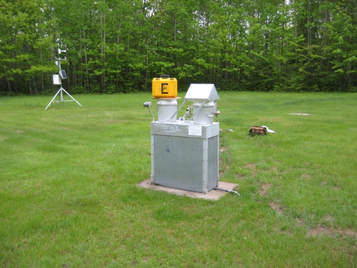
United States Department of Agriculture, North Central Soil Conservation Research Laboratory New research and data analysis is available presenting a third perspective from a rural and natural prairie environment in western Minnesota.  Swan Lake Research Farm is located in the North West corner of Section 35, Swan Lake Township, Stevens County (Approximately 6 miles north and 4 miles east of Morris, MN). 45o 41' N Latitude and 95o 48' W Longitude. Elevation 1211 feet. Data and research can be viewed here,
 I have now published the data for the forest and you can find it here Marcell Experimental Forest . Operated by the USDA Forest Service, this location serves as the Northern Research Station. This data supports and validates the data from the St. Paul Climate Observatory and demonstrates the heat gain associated with the conversion of land to human habitat. I will not be working on the Swan Lake data that gives 3 different sources of information, and all 3 supporting each other in heat gain and time frames.
With the Forest Data now available this has allowed us to review a 3rd and unique environment but depths are limited. I now have 3 locations with multiple data sets for various environments, all in Minnesota. The St. Paul U of M Campus Climate Observatory that measures down to 1,280cm since 1963, Swan Lake down to 300cm since 1997 to 2014, and now the Marcell Experimental Forest just north of Grand Rapids from 1990 through 2016 that will be coming soon. Swan Lake and the U of M were cross examined and demonstrated the same alterations, specifically the days of overturn that occurred during the year. There is a difference between depths of measurements, 150cm compared to 160cm, and 300cm to 320cm, a 10cm greater depth that would result in 7 additional days at Swan Lake above the Climate Observatory. and both are located very close in latitude. The fall of 2005 and spring of 2006 was not available. 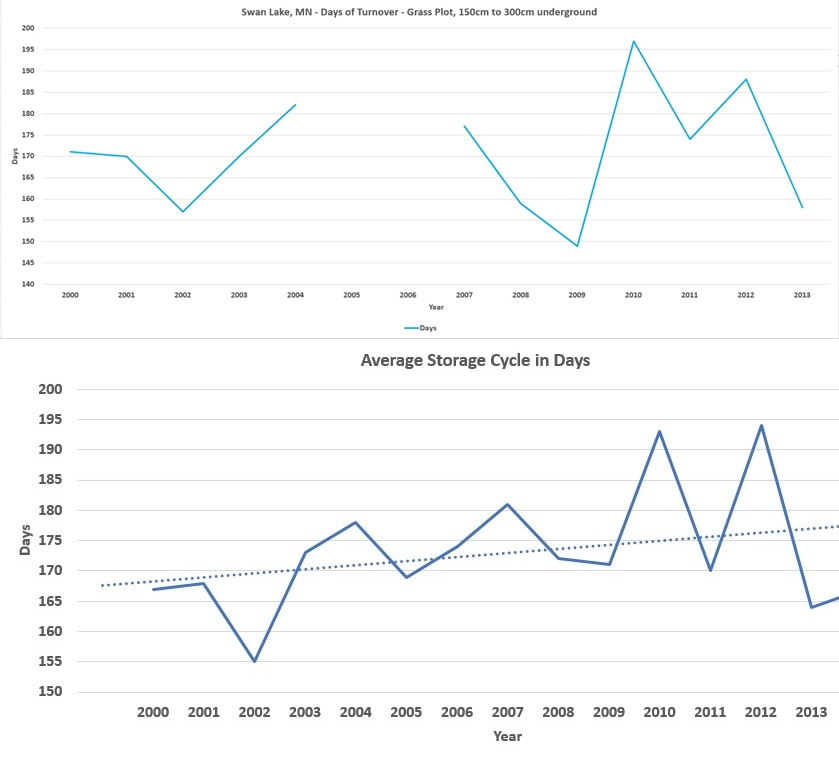 While preparing to meet a good friend and Physics Professor overseas I took the time to extrapolate the data and do further analysis on underground temperatures. As the data and graphs unfolded I found a cycle of heating that is escalating and rising fast, and the extended warmth and declining winters are due to this heat effect. What we are currently experiencing is just a minor release of energy that is preceding the main bulk of heat, and it's rising rapidly towards the surface. Although the source of accelerated heat effect is only a hypothesis, there has been no other reasonable explanation for such a massive increase over such a wide spread area in such a brief period of time, and it just makes sense. Our Heating Aquifers.
As winter approaches and cold air plummets down upon the North American Continent, the potential for earthquakes escalates due to the energy shift in the plates. As the continental plate cools as a mass, the laws of contraction apply creating pressure shifts along the boundaries with neighboring plates. Along with earthquakes, potential for large volcanic eruptions escalates shortly in January as pressure along the plate boundaries is relieved. This information and data is contained within this website.
I have not written far a while as I have been continuing with the research and analysis to submit this work for peer review. Using multiple methods data has been analyzed demonstrating that our worlds heating and cooling is controlled by the Earth, and this in turn drives our weather in response to a warming and cooling world. This heat is the power source that drives our world through the harmony that exists in the cycles, and these cycles create a charge and discharge of heating and cooling every year powering our world from one year into the next. During these transitions of energy, earthquakes naturally rise. Researching the driving force of our worlds heat a new web page was created with the data and analysis here, Earths Heat Source. You can visit the research page here, I have expanded this page with current research of the Mid-Atlantic Ridge. |
Archives
September 2019
Categories |
 RSS Feed