
A Thermal Switch is defined as "A switch that is activated by a given temperature or temperature variation."
Thermodynamic laws indicated that a cycle existed beneath the surface where the heat becomes trapped and builds during the summer and conduction flow from the core is shut down due to the temperatures being warmer on the surface than the subterranean region. During the winter, the conduction of heat flow releases subterranean heat and is limited by the resistance in the soils. Our planets switch is not a visible one, but is measurable and is termed the "Conduction Cycle" and "Transpiration Cycle" for common understanding. By the laws, definition and operation, this is classified as conservation of energy and is the major contributor to our worlds energy budget.
For a basic understanding of this event, if you placed your hand on a heating pad and then covered it with another heating pad, your hand would heat and build to the temperature of the heating pads. Now remove the top heating pad and and your hand will cool allowing the heat to be released, even with your palm still on the heating pad. Once a year this cycle occurs and is the major source of temperatures slowly and methodically rising over the years.
In order to confirm this, data was acquired from the University of Minnesota, St Paul Campus, Climate Observatory for analysis and confirmation. Underground temperatures have been monitored at this location down to 1280cm (42') in 160cm intervals since 1962.
In a scientific article published in 1966, "Climate of Minnesota, Spring Soil Temperatures" this Thermal Switch was found to be identified as an "Overturn" event.
“Another feature to observe is the temperature “overturn” that generally occurs between mid and late March. During winter and into early March, soil temperature increases with depth due to the cold and usually frozen surface soil (figure 7-9). With the appearance of spring and the warming that begins at the surface, an “overturn” occurs in the soil temperature. The upper part of the soil now remains warmer than the subsoil until a second and reverse “overturn” takes place due to the earth’s cooling in autumn and winter’s approach.
The "overturn" is due simply to the temperature change in the shallow depths because temperatures at deep depths change little during a season (figure 6). The temperature at 42 feet, for example, remains nearly constant at 48F, plus or minus about 0.5F, throughout the year. The shallow depth is by turn warmer in the summer and colder in the winter”
Considered an insignificant event, the Laws of Thermodynamics confirm this as a period of time where energy is conserved resulting in a charge/discharge event yearly. 53 years later, a new perspective is now available.
Research Data
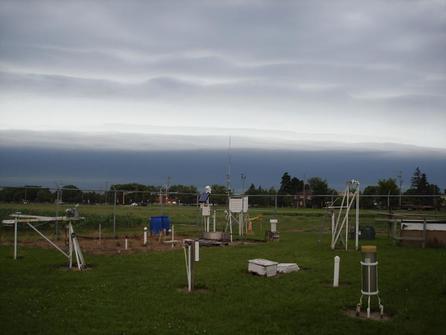
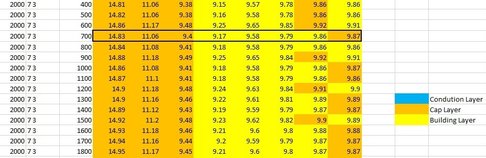
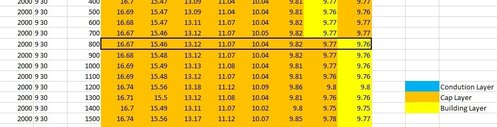
The following 14 data sets is the raw data acquired from the Climate Observatory for the year 2000 and colored for heat flow direction, periods of time where energy alters beneath the surface. In these sets, the blue is the “Conduction Layer” and the layer that allows the flow of heat to the surface., also known as the "Reverse overturn." Orange is the “Cap Layer,” also known as the "Overturn," and this is the layer that is emitting heat out into the surrounding layers. Areas below this that are less in temperature will be forced to build and increase in temperature and these regions are in yellow as the “Building Layer.” Trapped between two warmer layers, like your hand between two heating pads, will naturally increase in temperatures.
Thermal Equilibrium is given to the upper layer until the lower layer exceeds the previous layer, thermal equilibrium is then given to that layer. Once the heat is capped it should, by the laws, build from the top down and release the same way. Data begins at 160cm on the left and is in 160cm increments to a maximum depth of 1280cm on the right. The years 2000 to November of 2015 were online but no longer available for remote confirmation, but I have created a download page for these files you can download by clicking here. It is natural to look at the temperatures, but thermodynamics looks at directional flow, and the temperatures follow in time.
Beginning at the start of the year, in the middle of winter, the first transition occurs on January 4, 2000, at exactly 04:00. The energy flow to the surface moved the cap from 480cm down to 640cm. The amount of energy released is based upon the resistance in the soils and the temperature differentiation between them.
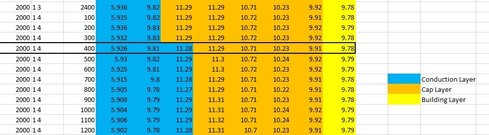
In this data set we see that on February 9, 2000, at 20:00, the energy loss now declines from 480cm down to 640cm beneath the surface, and within 48 hours the cap layer moves to 800cm. Temperatures at 1280cm continue to rise as the temperatures above this region, 800, 960 and 1120cm maintain a value greater, and heat slowly rising below. Although the surface is cooling, the subterranean is warming.
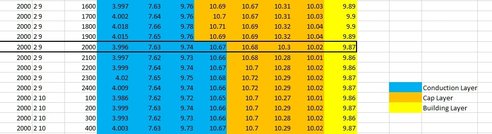
As energy continues to be released, on April 2, 2000, at exactly 01:00, the conduction forces the energy cap from 800cm down to 960cm and locks.
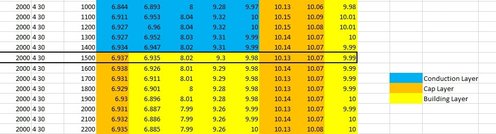
On April 30, 2000, at 15:00, the “Thermal Switch” activates and overturn has now began and the energy begins to build. The temperature at 160cm is now warmer than the layers below resulting in a reversal of energy flow, also known as the "Overturn.". Conduction of heat flow coming up from the core to the surface is now shut down. The axial tilt allowing more hours of energy upon the surface, in conjunction with the atmosphere, naturally conserves this energy under the Continental Plates.
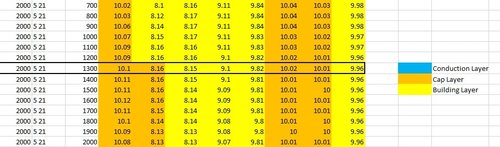
On May 21, 2000, at exactly 13:00, the temperatures build and the cap moves from 160cm down to 320cm. All the regions in yellow are building and all the heat is flowing towards the surface. While the deeper layers are releasing their heat into the regions above, they are continuing to raise the heat levels in the regions below..
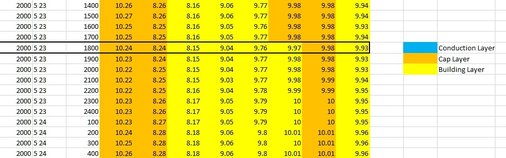
On May 23, 2000, at 18:00, the lower cap supplying energy to the upper layer now recedes from 960cm to 1120cm and caps within 48 hours. With the energy capped on the top, this recession of heat indicates that the planets ability to release energy exceeds the level of energy rising up from the core. When the conduction flow becomes long enough, and the “Thermal Switch” becomes short enough, permafrost develops.
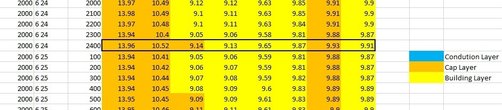
On June 24, 2000, at 24:00 the heat caps at 480cm within 5 hours, and continues to build.
On July 3, 2000, at 07:00, the lower cap continues to recede down to 1280cm and locks in within 48 hours as the energy continues to fuel the upper layers with energy.On June 24, 2000, at 24:00 the heat caps at 480cm within 5 hours, and continues to build.
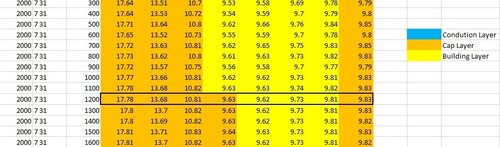
On July 31, 2000, at 12:00, the energy continues to build downwards to 640cm and in less than 48 hours locks in at this layer.
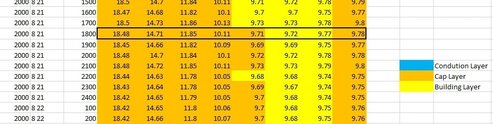
On August 21, 2000, at 18:00, the energy builds down to a depth of 800cm and locks in within 19 hourslayer.
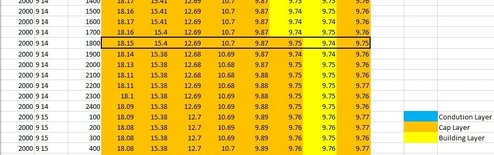
On September 14, 2000, at 1800 the energy flow continues to recede down to a depth of 960cm and locks in within 24 hours
On September 30, 2000, the energy is now locked in down to the depth of 1120cm at exactly 08:00. At 960cm, 1120cm and 1280cm, equilibrium reaches its closest point during this month.
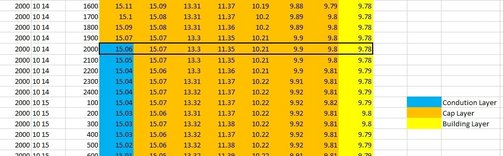
On October 14, 2000, at 20:00, conduction flow begins and the switch opens allowing the conserved heat throughout the summer to begin exhausting. The axial tilt decreasing the amount of time the solar energy is exposed to the surface naturally creates this effect, in conjunction with a cooling atmosphere
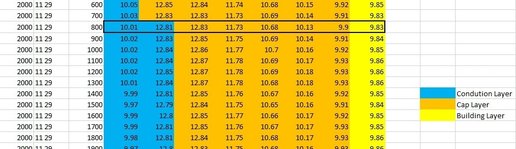
On November 29, at exactly 08:00, the energy flow now declines to 320cm. On January 1, 2001 at 01:00 the energy receded down to 480cm, and this cycle then repeats itself.
This process is vital in understanding our planets operation before understanding the current research. It's the major form of energy storage for our planet. answering Joseph Fourier's question, "How do we heat to the levels we do.?" We all understand the influence of the sun by the higher temperatures during the day compared to night, or the hours of sunshine we have in the summer, and the declining hours in the winter. On August 21st the surface soils and temperatures are so much warmer than April 21st, even though both days have the same amount of sunlight. Neither the sun, core, or the atmosphere can account for this. This is due to this thermal switch and the harmony that exists between the Earth and Sun and is verified by the ground temperature data.