United States Department of Agriculture, North Central Soil Conservation
Research Laboratory
Swan Lake Research Farm is located in the North West corner of Section 35, Swan Lake Township, Stevens County (Approximately 6 miles north and 4 miles east of Morris, MN). 45o 41' N Latitude and 95o 48' W Longitude. Elevation 1211 feet. Their site, and shallow depth soil temperatures can be viewed here.

The USDA provides massive amounts of data available, and at Swan Lake they record temperatures from 5cm deep down to 300cm under two separate environments, bare soil and grass plot. Full year data was available from 1998 through 2013 and contained the daily high, low, and mean temperatures for each year.
Located on the western edge of Minnesota, the natural habitat would have been prairie with a mix of forests around the lakes, streams and valleys in this region. Highly productive farming in this region today, the data collected is primarily used for optimizing farm production. This data is used to cross reference and compare with both the St. Paul Climate Observatory and the Marcell Experimental Forest.
Located on the western edge of Minnesota, the natural habitat would have been prairie with a mix of forests around the lakes, streams and valleys in this region. Highly productive farming in this region today, the data collected is primarily used for optimizing farm production. This data is used to cross reference and compare with both the St. Paul Climate Observatory and the Marcell Experimental Forest.
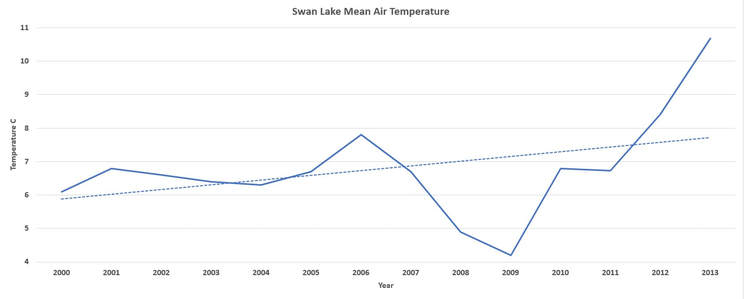
A quick analysis of the recent air temperature demonstrates a slow rise in surface temperatures since 2000 and mirrors the slow rise in temperatures in Minneapolis/St. Paul metro area.
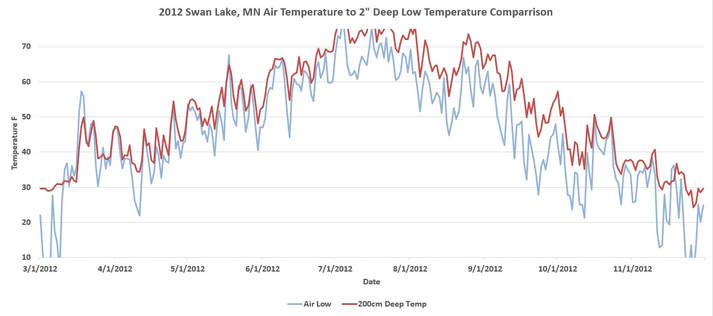
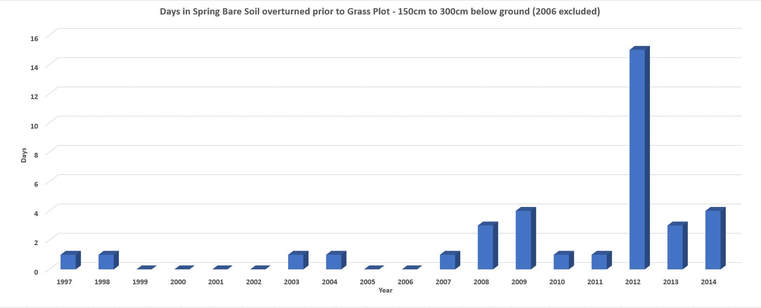
Verification of Thermal Switch Event
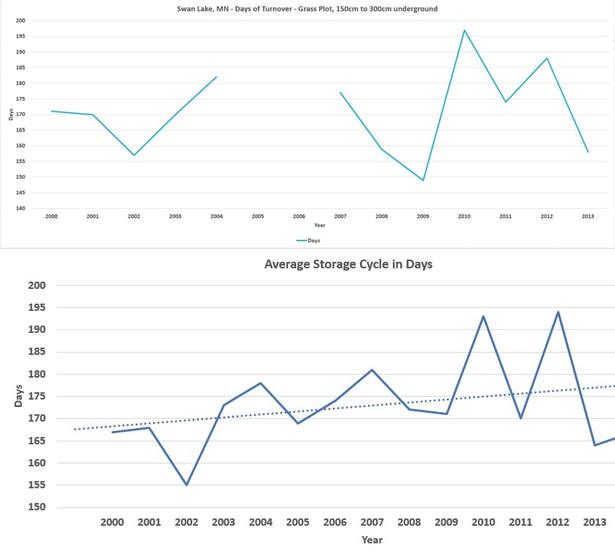
Underground data at Swan Lake is recorded at 150cm and 300cm and the St. Paul Climate Observatory records temperatures at 160cm and 320cm. The additional 10cm of soil depth, along with the slightly shallower depths, will slightly increase the total number of days at Swan Lake compared to St. Paul. There is a gap in records due to equipment malfunctions in the fall of 2005, through the spring of 2006 and these years were omitted from the graph. As the image to the right demonstrates, the activation of the underground thermal switch followed the same pattern as the Climate Observatory. This confirms that this process is not an isolated occurrence, but a very large scale event that is a determining factor in surface temperatures and climate conditions. |
|
Confirmation of Heat Source
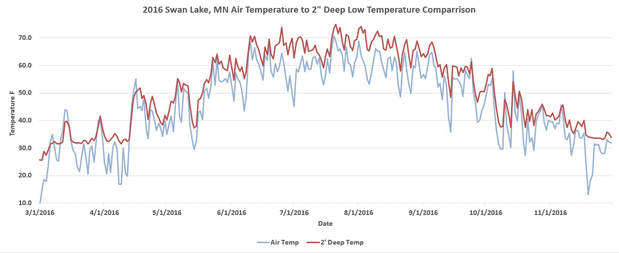
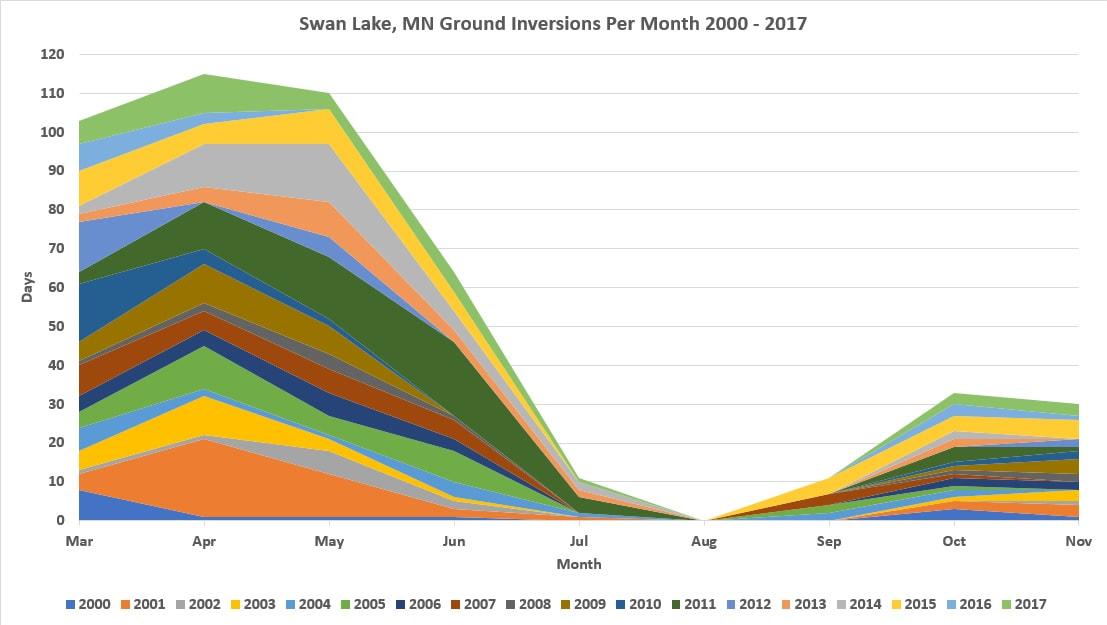
In 2016 the low air temperature at night exceeded the temperature 2" underground on 14 occasions between March 1 and November 30. This is 275 days averaging only 3.7% of the nights. From April 16th to October 10th, the air temperature was never greater than the temperature 2" below ground.
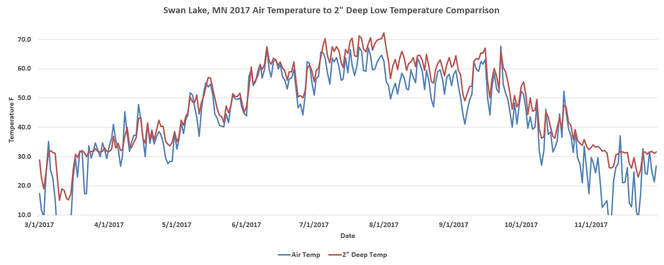
In 2017 there is a noticeable increase and attained an average near the 2000 Climate Observatory data and Minneapolis International Airport records when ground inversions occurred 8% of the nights. During this time the low temperatures at night exceeded the ground temperatures on 32 occasions, or 9.8% of the time. From July 4th to October 12th, the ground temperature continually remained greater than the air temperature.
The increase in the summers heat of 2012 demonstrates a widening gap between the ground and surface temperature, particularly at the end of the summer. This increased thermal mass maintains the heat longer delaying the onset of winter.
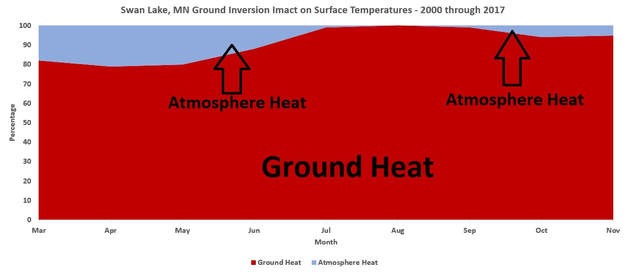
From 2000 to 2017 night time temperatures were examined from March to November and the above graph demonstrates the total monthly percentage from 2000 - 2017. Out of 4,950 days, there was a total 477 nights when a ground inversion occurred and accounts for 9.63% of the time. Since 2000 there has never been a ground inversion in the month of August, and only occurs 1% of the time in July and September.
|
This graph is a zoomed in view of the atmospheric heat. This demonstrates the number of nights by month when the atmosphere is warmer than temperature 2" below ground from 2000 through 2017.
|
ENERGY SHIFTS
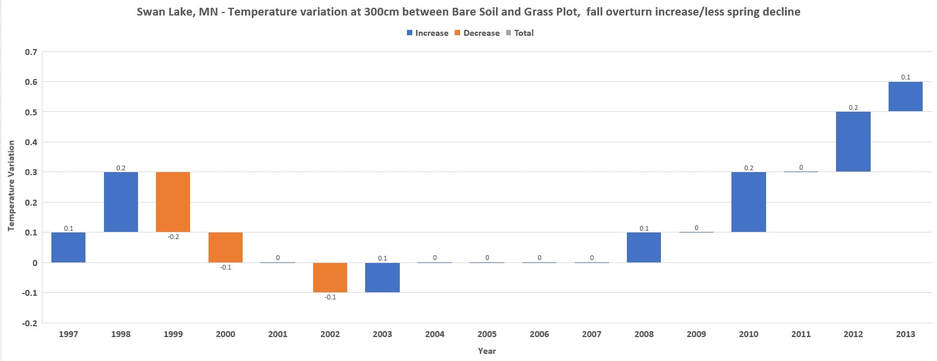
Every spring the grass plot overturns the same day or just after the bare soil, but due to the level of conduction under the bare soil the temperatures are continually lower than the grass plot when this occurs. In the fall, the bare soil switches prior to the grass plot due to the increased temperatures and thermal conduction during the summer. Using the date the grass plot overturns in the spring and fall, and the differentiation in temperatures of the bare soil at that time, the following chart was created. This attains a rough calculation of warming/cooling per year. The St. Paul Climate Observatory is far more accurate and can attain energy differentiation's down to the hour and to depths necessary for accurate measurements. Due to the time frames available the 2013/14 year is not included that would have forced a decline, but since 2007 there is noticeable yearly rise in temperatures.
There was a noticeable change in the number of days that the spring overturn event occurs under the bare soil compared to the grass plot. From 1997 through 2007 the switch occurred under bare soil either the same day, or the day after. After 2007 there has been a shift in this pattern and is demonstrated in the graph to the right with a greater delay 5 out of 7 years.