Decoding Earth
  • Who We Are
  • How am I affected?
  • Store
  • Blog
  • Get In Touch
  • Data and Research
    • Heat source
    • Heat Discharge
    • Earth's Thermal Switch
    • Research and Analysis
    • U of M
    • Unveiling the Forest
    • Swan Lake
    • Heating Aquifers
    • Means of Measure
    • Conduction and Transpiration
    • Human Impact
    • Seasonal Impacts
    • Volcanic Seasons
    • Earthquake Cycles
    • Heat Flow
    • Global Dimming
    • Climate Change/Global Warming
    • Hurricanes, Typhoons and Cyclones
    • Water
    • Oceans >
      • Pacific Ocean
    • CO2 and its Cycles
    • Earths Magnetic Field
    • Oil Shale and Tar Sands >
      • Williston Geothermal Heat Effect
      • Bakken Shale
      • Stored Energy Calculations
    • Change
    • Human Population Growth
    • Sustainability
  • Oil production and Earthquakes
  • Downlaodable Files
  • Crop Blog
  • Serenegirl
  • Earth's Thermal Switch the Driving Force Behind Climate Change
  • Spirit of Hope for Women - Africa (SOHFA)
  • Profile
  • Decoding Earth's Hidden Secrets

Hurricanes, Typhoons and Cyclones

As water heats, there is a greater level of evaporation.  With warming continental plates, heat will bleed out into the oceans, increase deep sea volcanic activity, and alter the jet streams.  The differentiation between heat and cold generates our winds and storm activity, and as the world heats there will naturally become more storms along with greater intensity.  After the "Dust Bowl" event of the 1930's, North America cooled until the 1970's.  The resistance to incoming solar radiance due to air pollution had decreased the amount of incoming solar energy that resulted in a cooling period.  In 1970 the EPA was enacted and North America began to warm again as this resistance was removed.  Based upon the scientific research into this period would also mean that regions with massive air pollution today would also be experiencing a cooling period, such as China, India and SE Asia and is identified in storm activity.

Regions surrounding the North America Plate

Picture

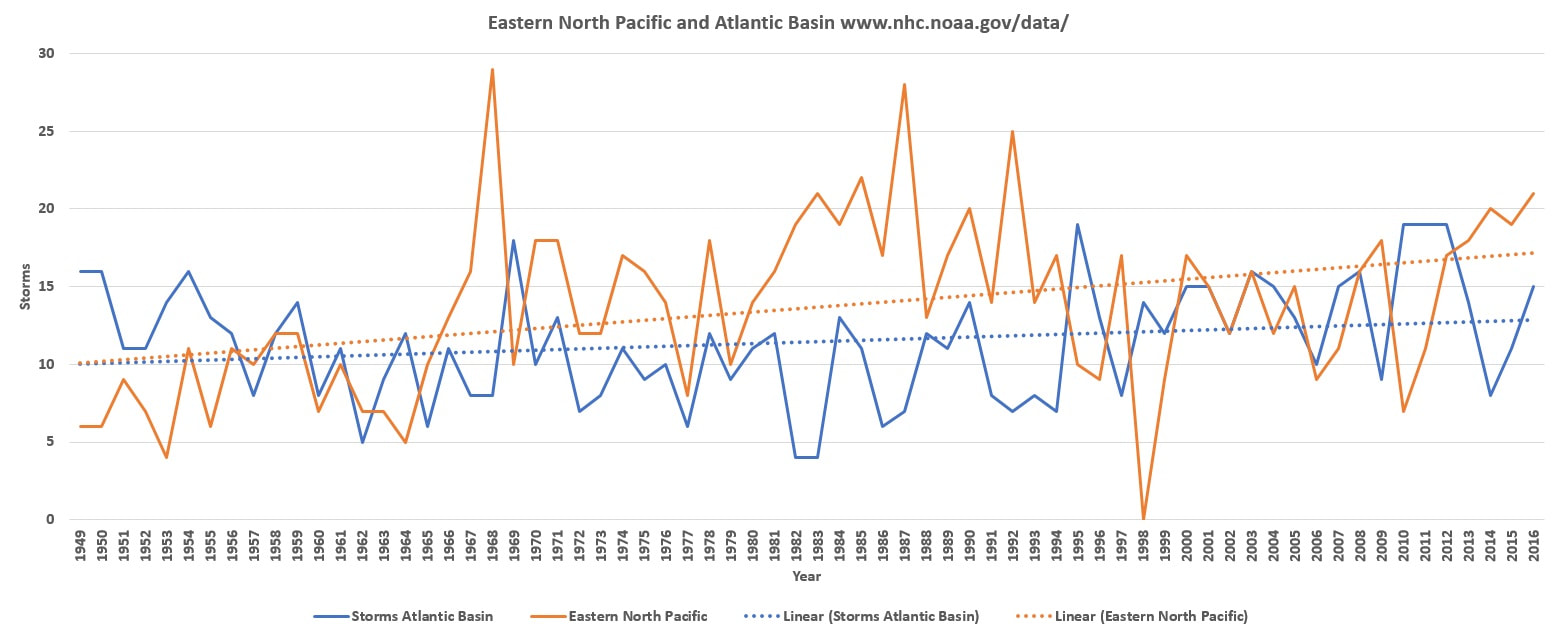
 In the North Atlantic hurricanes continue to rise even though the Gulf had been quiet for many years, until 2017.  In 1949 an average of 10 hurricanes occurred every year, and now they have risen to 13, a 23% increase.  In the Eastern North Pacific, many being generated from the Baja of California region, has risen from 10 to 17 today, a 61% rise.  Some people have associated this increase with better observation, but the following graphs exclude this perception.

Central Pacific

Picture
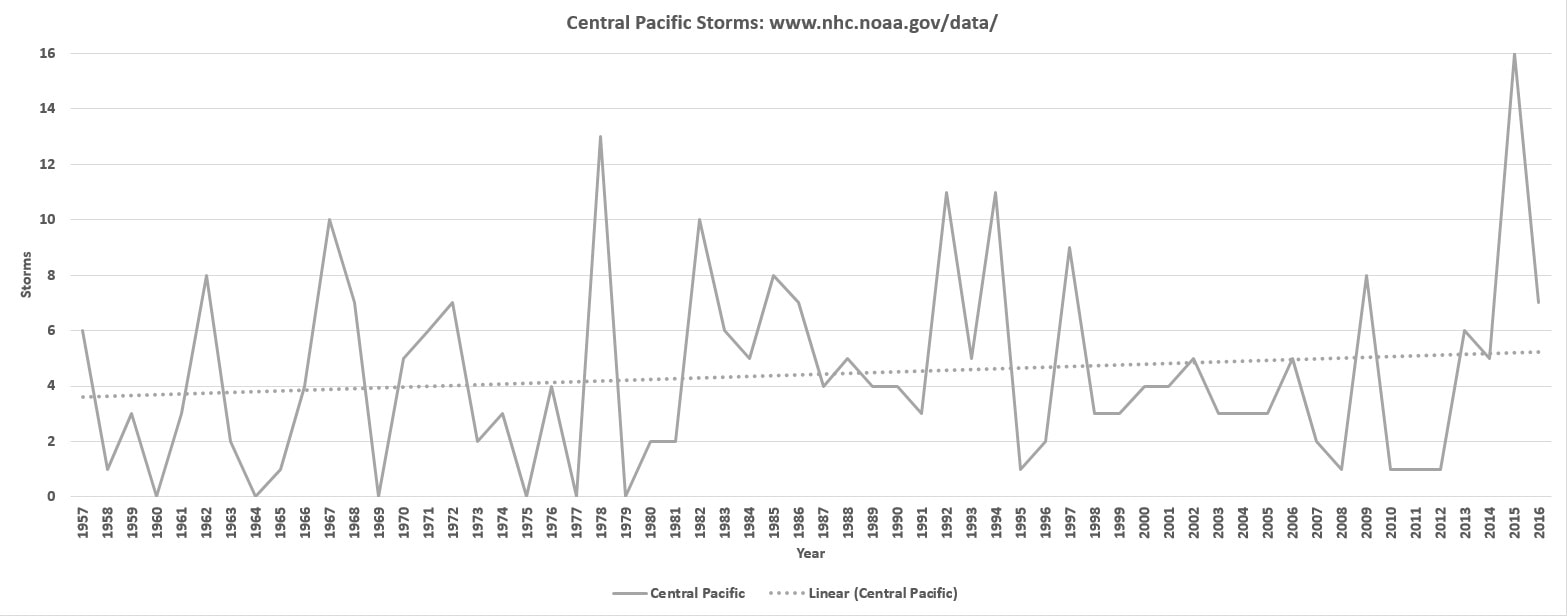
In the Central Pacific hurricanes have increased slightly from just under  4 to just over 5 today.  Away from large land masses, the alterations naturally decline.

North Indian Ocean

Picture
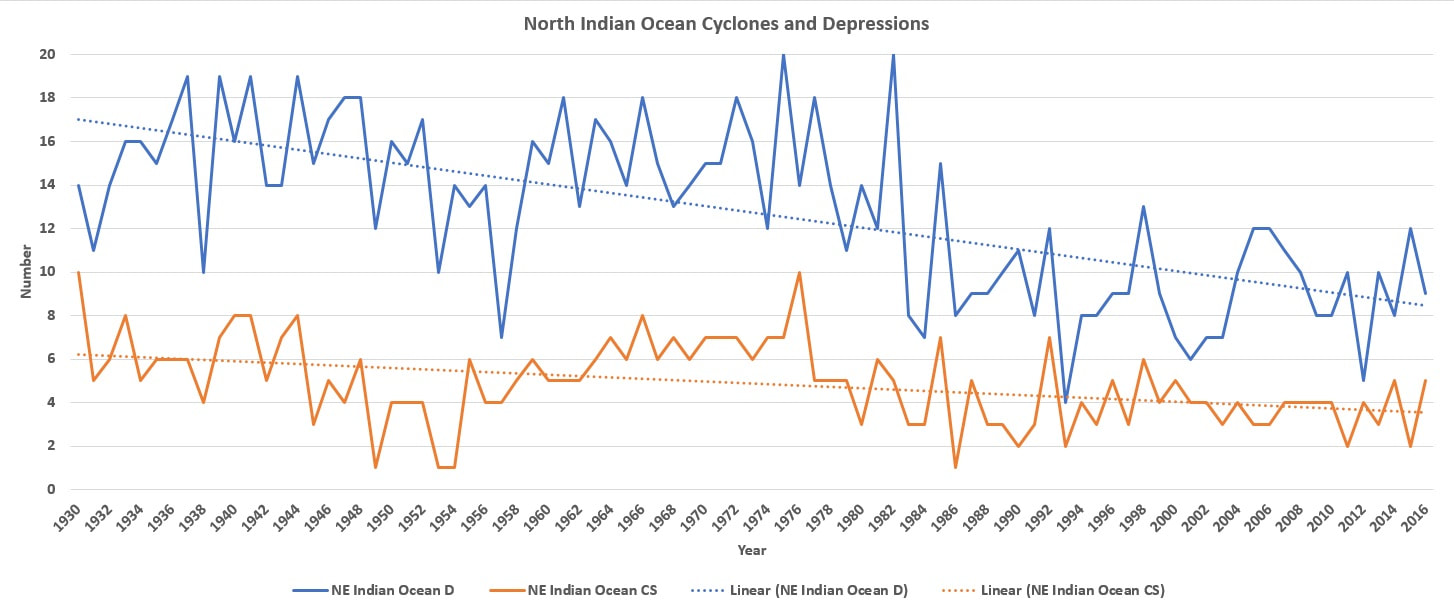
In the 1980's we begin to see a marked decline in Cyclones and Tropical Depressions in this region.  Air pollution in this region was rapidly rising resulting in a continual decline of solar radiance upon the surface.  Over time, this has resulted in a decline in these events, the same as experienced in North America in 1950's and 60's.   Since 1930, Cyclones have declined from 6 per year to less than 4, a 33% decline.  Tropical Depressions have declined from 17 to just more than 8 today, more than a 50% decline.  This has resulted in altered monsoons, and less rainfall inland increases inland temperatures in some regions, while many regions will experience cooling as a result of the obscured solar energy and cooling ocean jet streams. 
Home Page
Data Page

What Can We Do?

"There are three primary factors which can help influence our environment for the betterment of future generations. First, we must educate our youth on the critical success factors to maintaining and improving our earths resources. Secondly, we must stop all shale production and all activity that heats the earth beneath us. Finally, we need to replant our earth and hold back the water that we currently allow to run off and find its way back to the sea. As the ultimate machine, our EARTH, was created to grow and evolve."

Contact Us

    Subscribe Today!

Submit
  • Who We Are
  • How am I affected?
  • Store
  • Blog
  • Get In Touch
  • Data and Research
    • Heat source
    • Heat Discharge
    • Earth's Thermal Switch
    • Research and Analysis
    • U of M
    • Unveiling the Forest
    • Swan Lake
    • Heating Aquifers
    • Means of Measure
    • Conduction and Transpiration
    • Human Impact
    • Seasonal Impacts
    • Volcanic Seasons
    • Earthquake Cycles
    • Heat Flow
    • Global Dimming
    • Climate Change/Global Warming
    • Hurricanes, Typhoons and Cyclones
    • Water
    • Oceans >
      • Pacific Ocean
    • CO2 and its Cycles
    • Earths Magnetic Field
    • Oil Shale and Tar Sands >
      • Williston Geothermal Heat Effect
      • Bakken Shale
      • Stored Energy Calculations
    • Change
    • Human Population Growth
    • Sustainability
  • Oil production and Earthquakes
  • Downlaodable Files
  • Crop Blog
  • Serenegirl
  • Earth's Thermal Switch the Driving Force Behind Climate Change
  • Spirit of Hope for Women - Africa (SOHFA)
  • Profile
  • Decoding Earth's Hidden Secrets