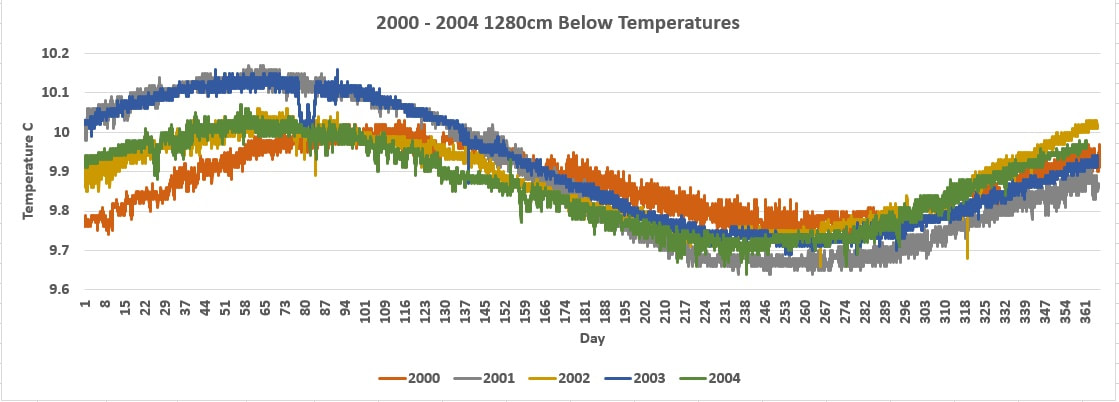
Using the 2000 to 2004 as a base line for temperature gradients, the following graphs were created to demonstrate the alterations and affects over recent years. These years are then broken down into three time periods, 2005-2008, 2009 - 2011, and 2012 to November of 2015, the end of date available. The depths are plotted out at depths of 1280cm, 960cm, 640cm, and 480cm. Overall temperature alterations per year increase and decrease has never exceed a +.5C rise, or more than a .6C decline from one year to the next through 2005. Overall average temperature increase beneath the surface has averaged only .05C rise per year. The years 2000 to November of 2015 were online but no longer available for remote confirmation, but I have created a download page for these files you can download by clicking here.
Temperature Gradients at 1280cm Below Ground, 2000 to 2015
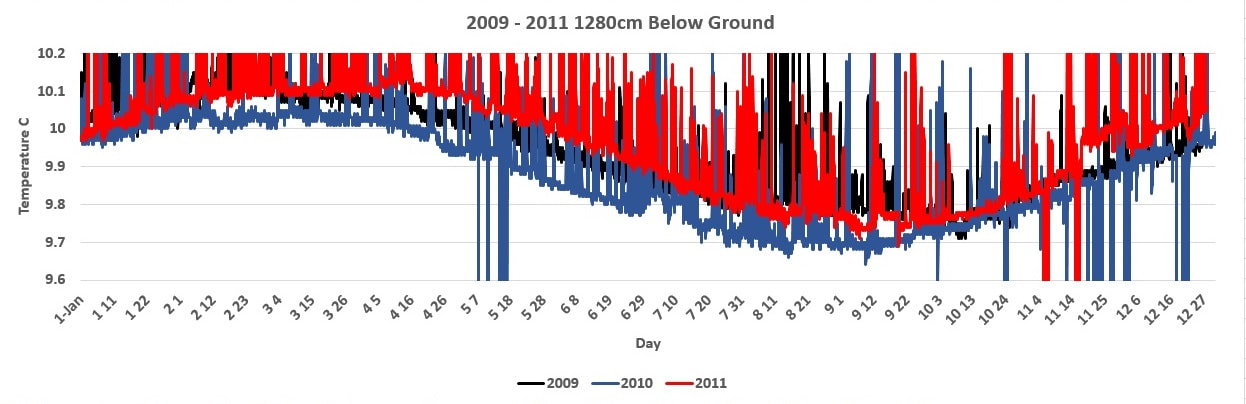
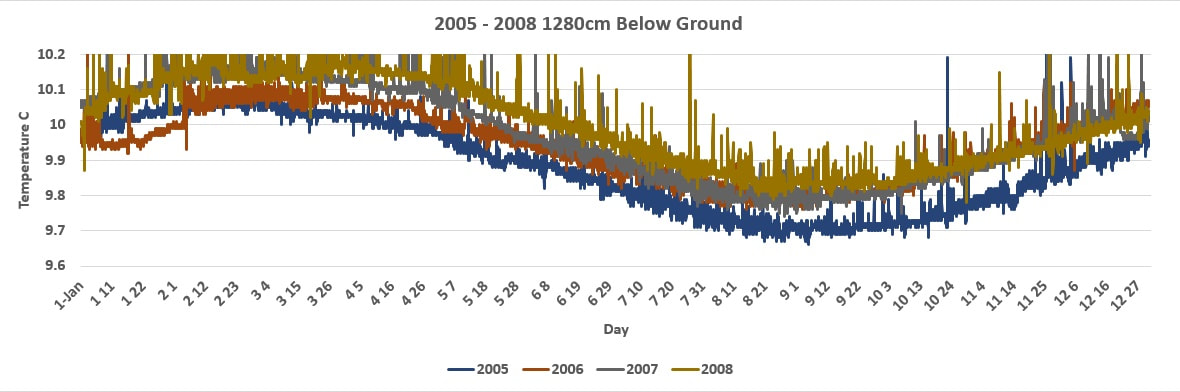
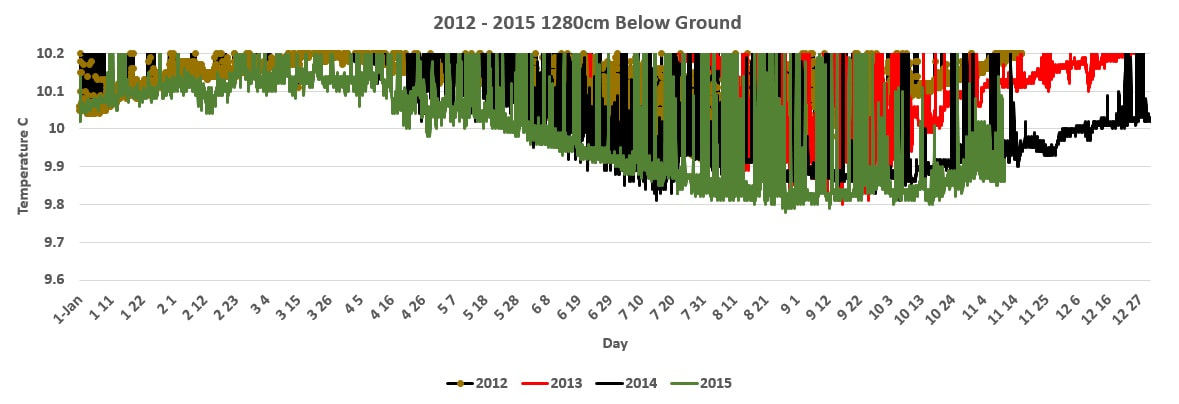
During this period of time temperatures never increased/decreased more than .05C per hour and remained very stable at this depth. In 2005 temperature alterations were measured at rates greater than normal and temperatures continued to fluctuate through 2008. In 2009 the temperatures began to oscillate at much greater levels including low temperature flux's demonstrating water within this airless environment, specifically when the timing and layers being affected are pulsing together. In 2012 the cooling stopped.
|
|
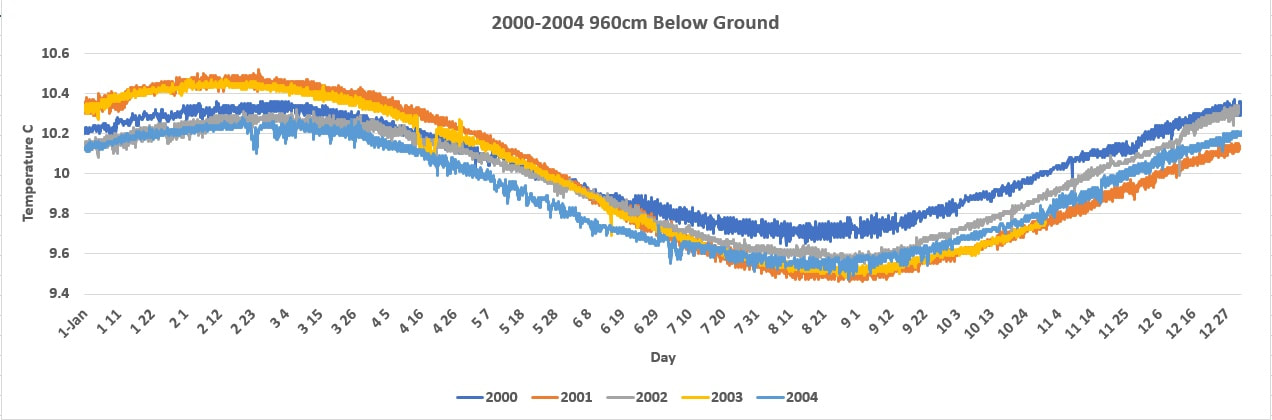
Temperature Gradients at 960cm Below Ground, 2000 to 2015
At 960cm we see a mirror image of 1280. Oscillations appear to be less, but this is due to the temperature variables at greater ranges. As we travel towards the surface, the temperature gradients alter greatly due to the external energy placed upon the surface by the sun.
|
|
|
|
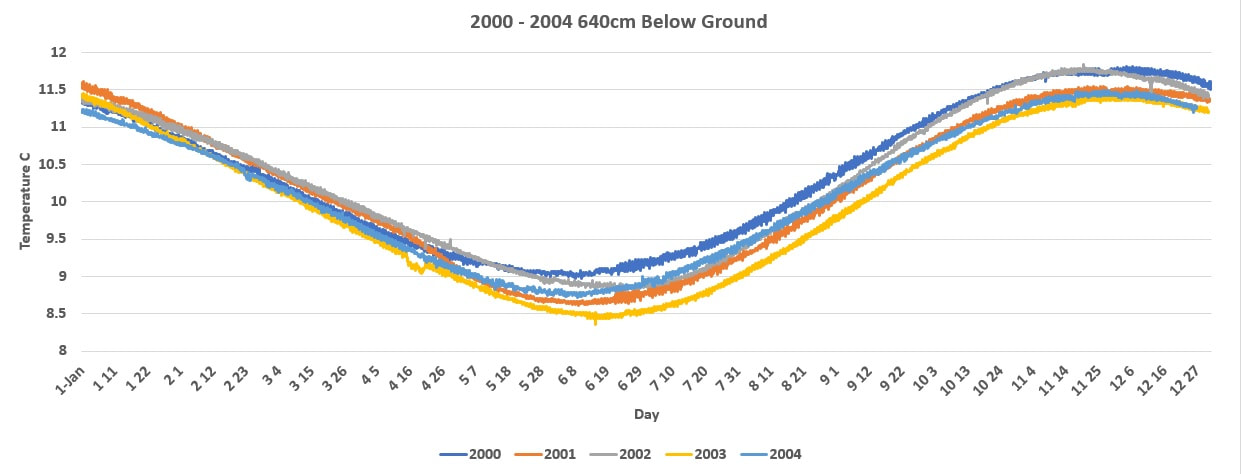
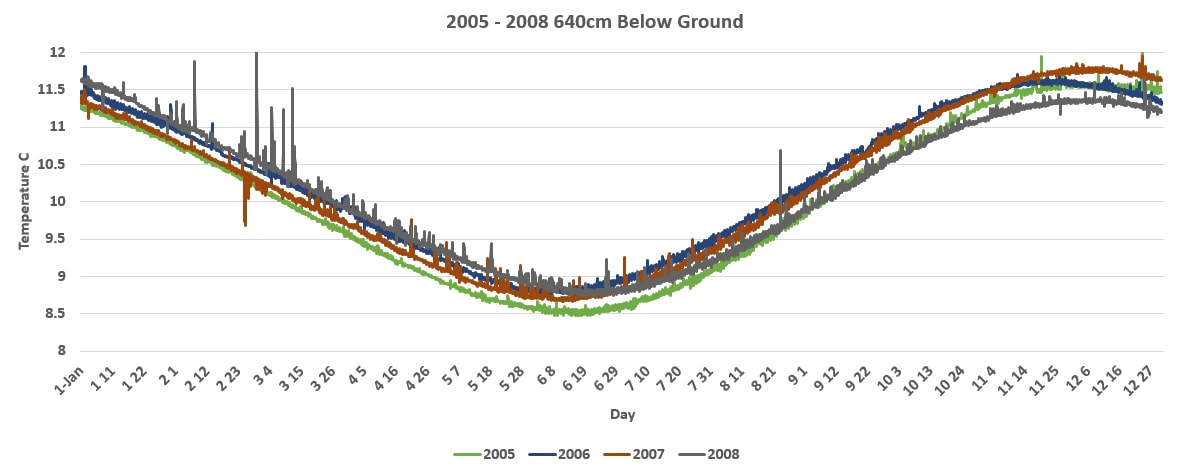
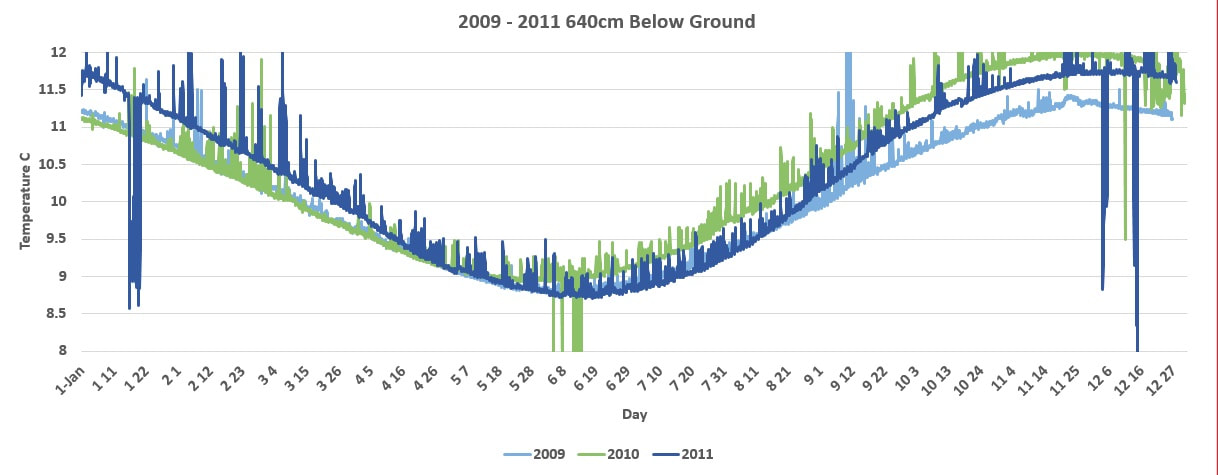
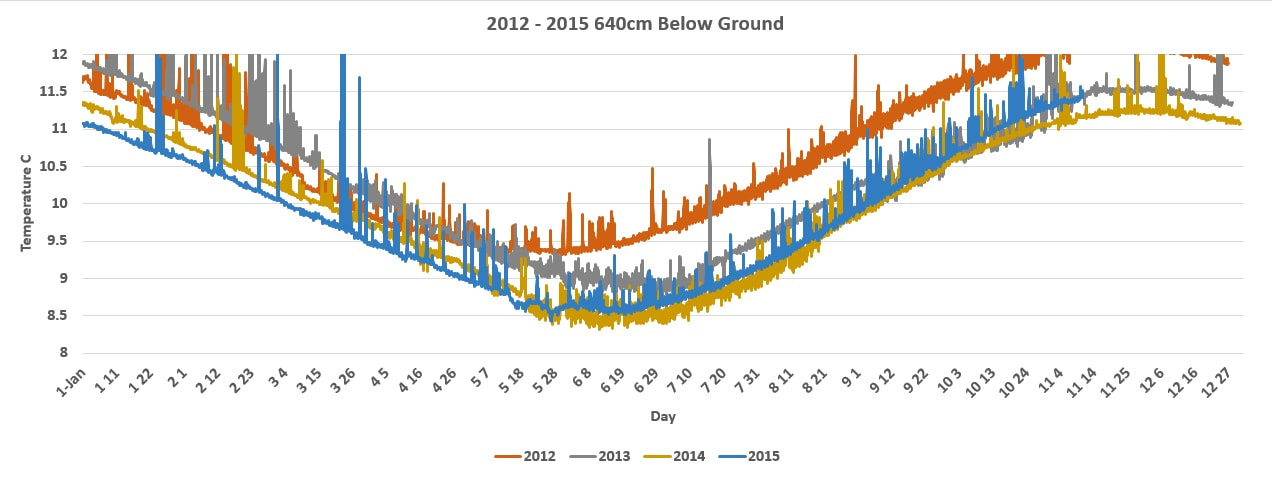
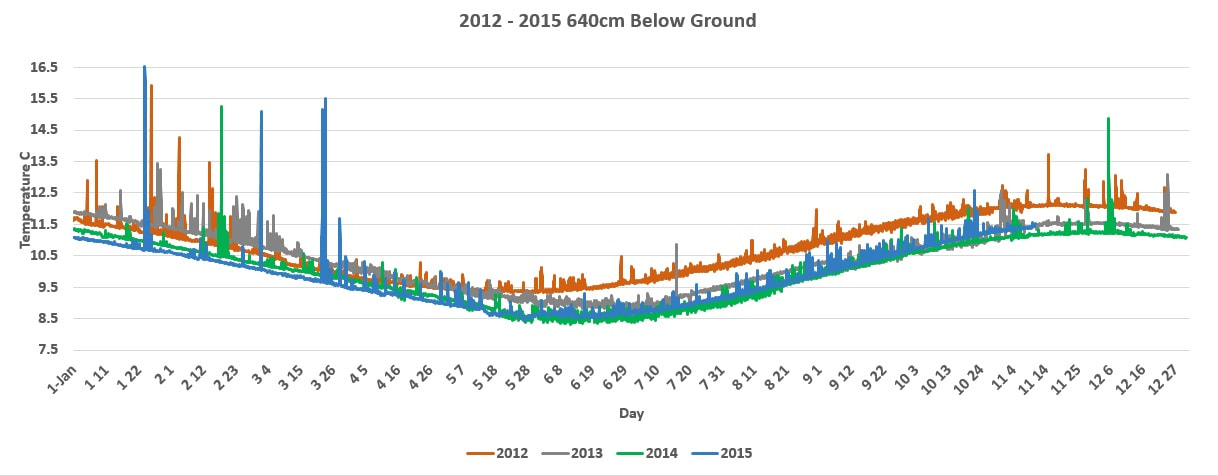
Temperature Gradients at 640cm Below Ground, 2000 to 2015
At 640cm we see that, excluding a dip in temperatures in 2007, heating began in 2008, 3 years after being first registered in 2005 at 1280cm. This indicates that the heat is rising from deeper levels towards the surface over time.
|
|
|
|
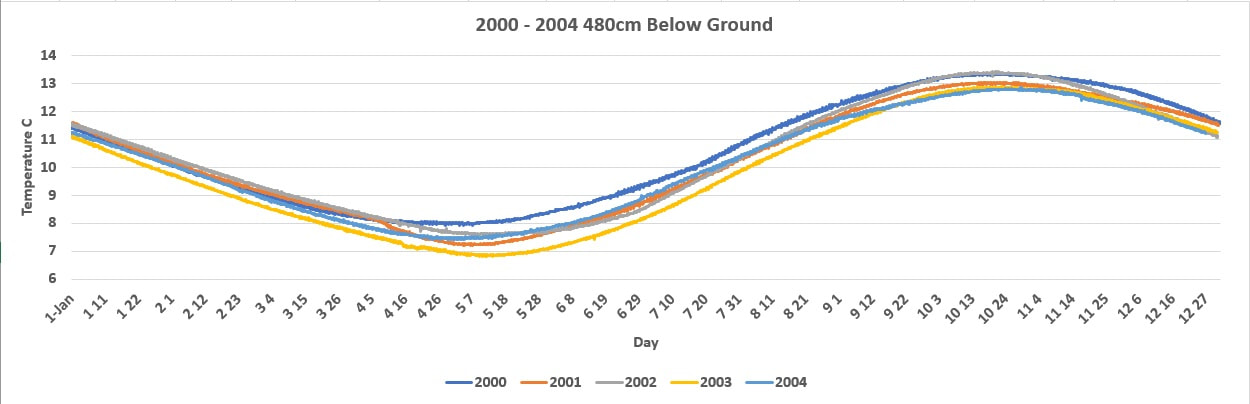
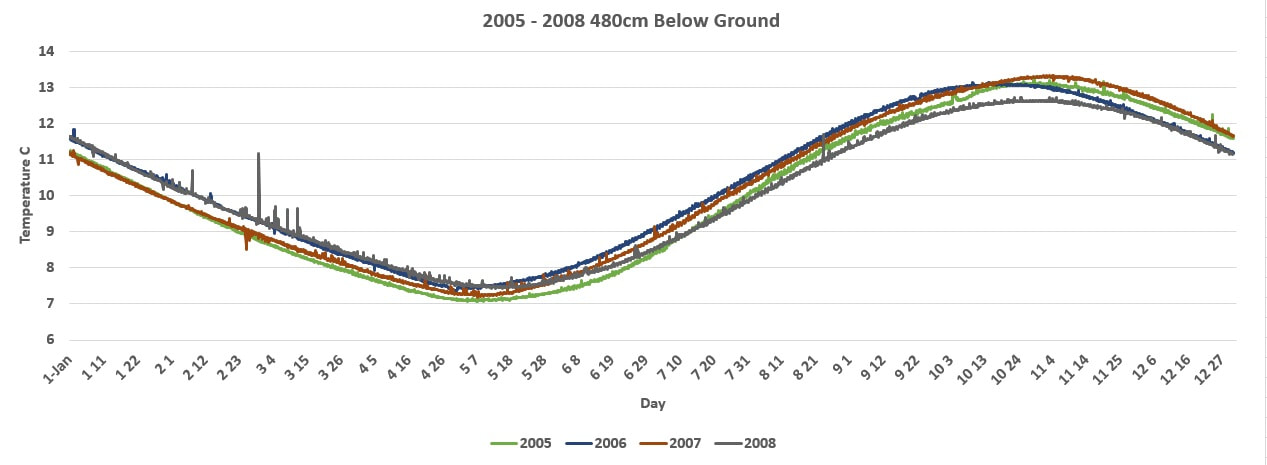
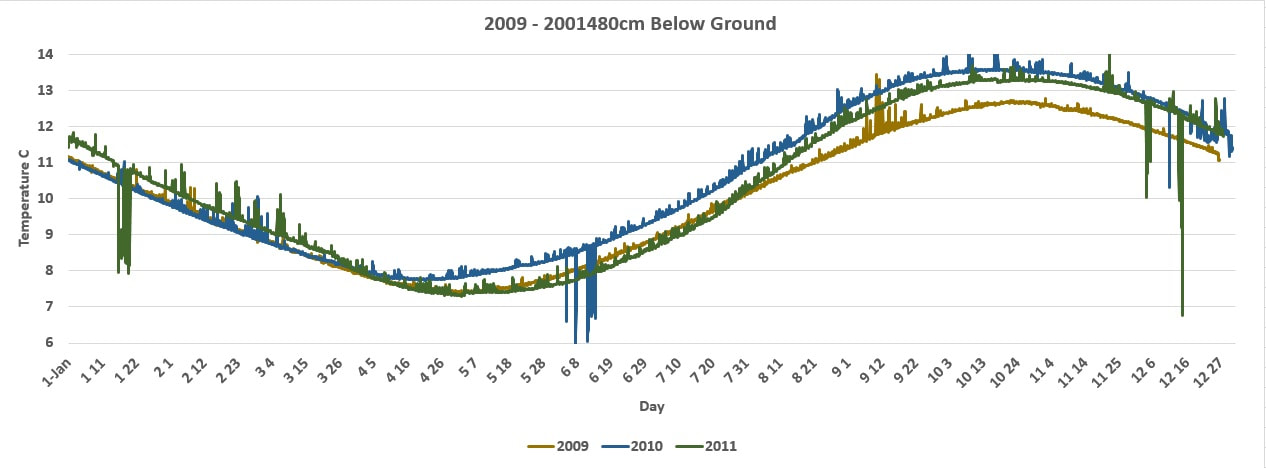
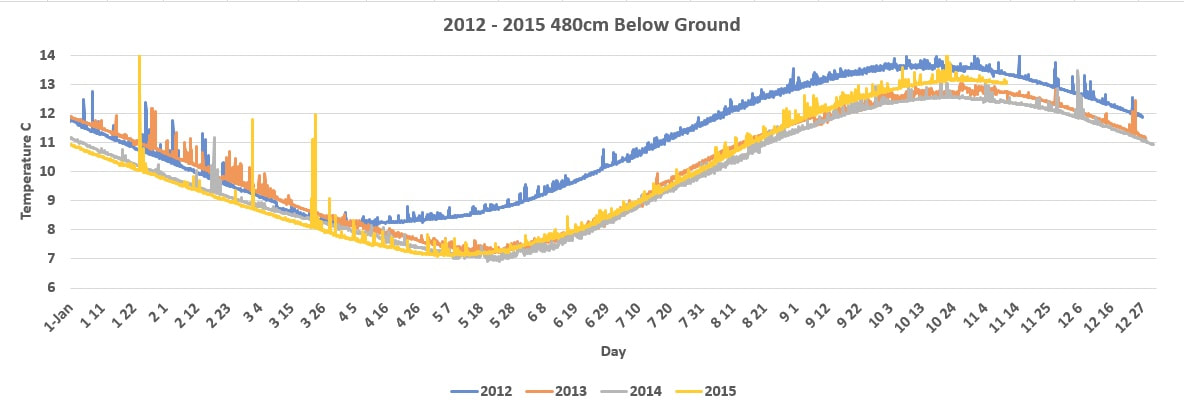
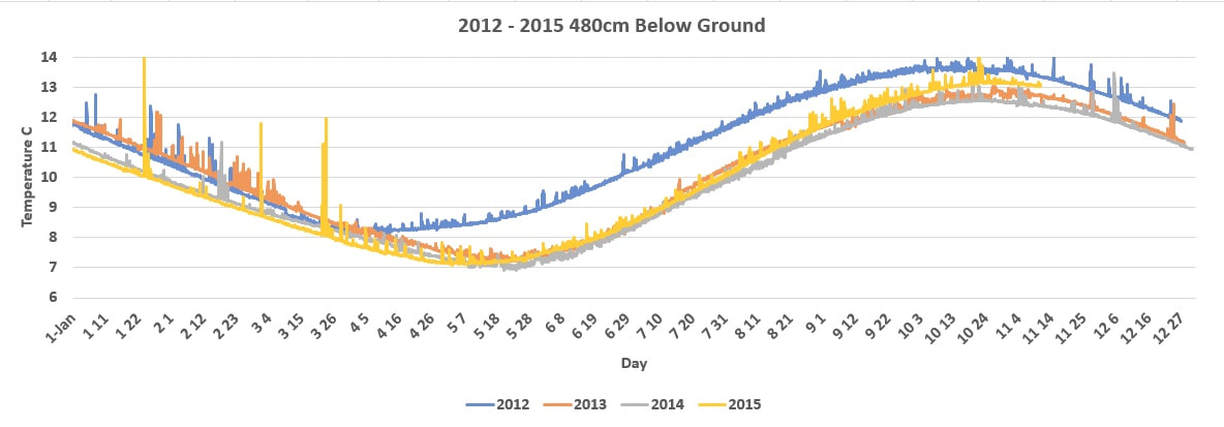
Temperature Gradients at 480cm Below Ground, 2000 to 2015
At 480cm we see the heat following the same pattern as seen at 640cm with a slightly less impact indicating that this is near the upper edge of the water tables for this specific region.
|
|
|
|
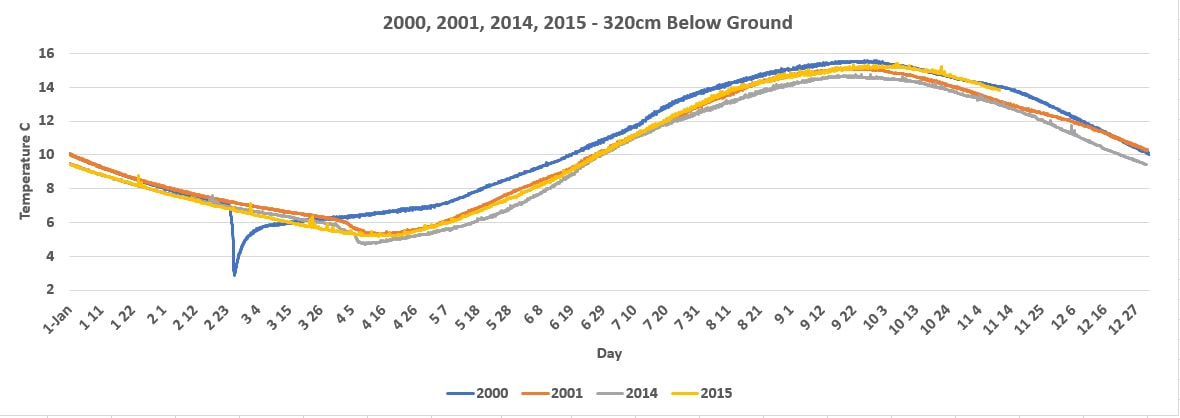
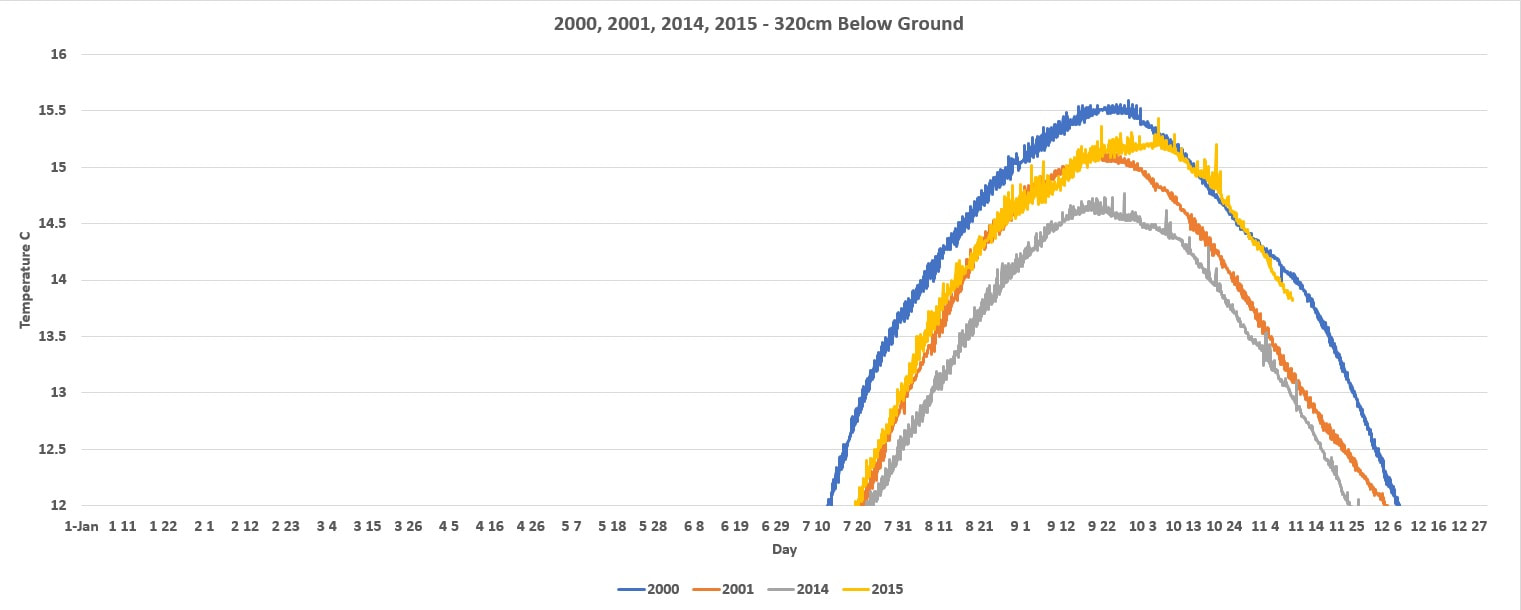
Temperature Gradients at 320cm Below Ground, 2000 to 2015
At 320cm we see no oscillation in temperatures when comparing 2000 and 2001 with 2014 and 2015. The image on the right is a close view to determine oscillations due to the greater extremes experienced as we travel closer towards the surface. This region is not deep enough to reside within the water tables and is insulated by the soils demonstrate only slight surges in comparison to other regions maintaining a more constant daily variations, but greater yearly extremes. All the oscillations in temperatures are found in regions below this depth confirming that the source of energy is rising up layer by layer.
|
|
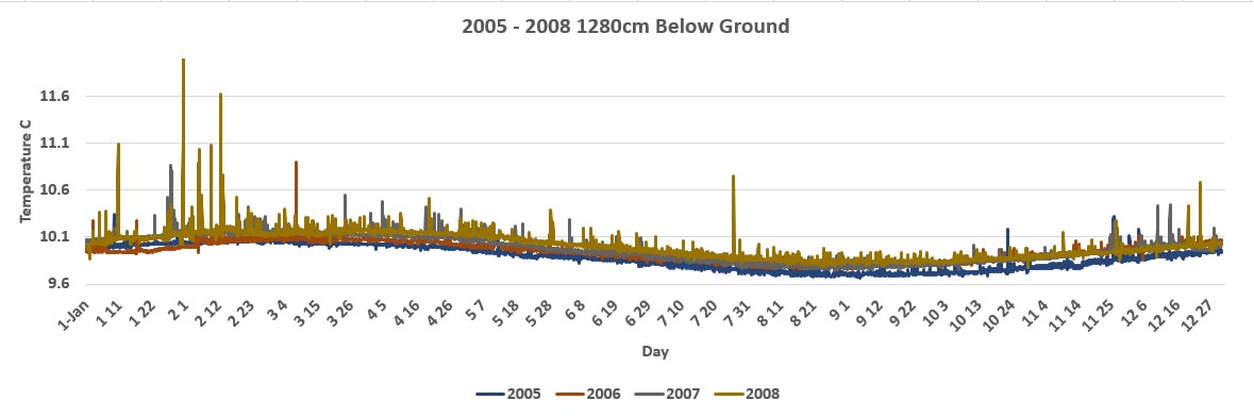
Periods of Surging Expanded View
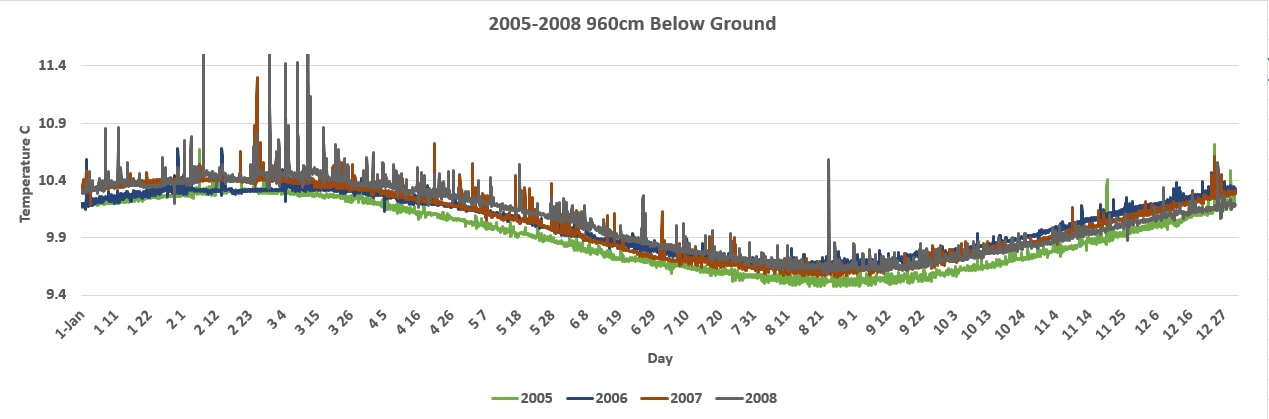
In order to observe the degree of oscillations we expand the temperature ranges for an overall view by years beginning in 2005. This demonstrates the heat flux occurring at the 1280cm and 960cm levels. While the 640cm region demonstrated oscillation, it did not exceed the base line of 2000 to 2004, meaning that the graph for this time period would be a duplication of the one above.
2005 - 2008

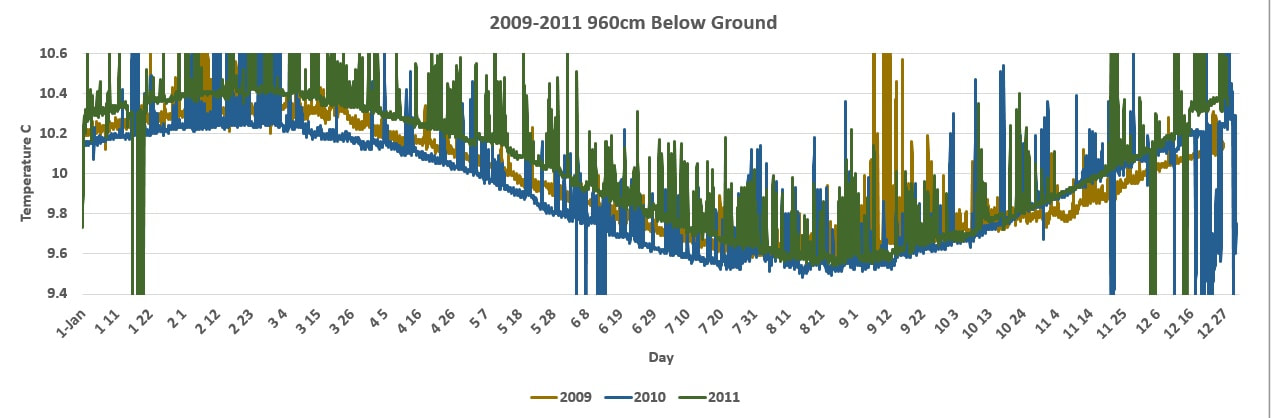
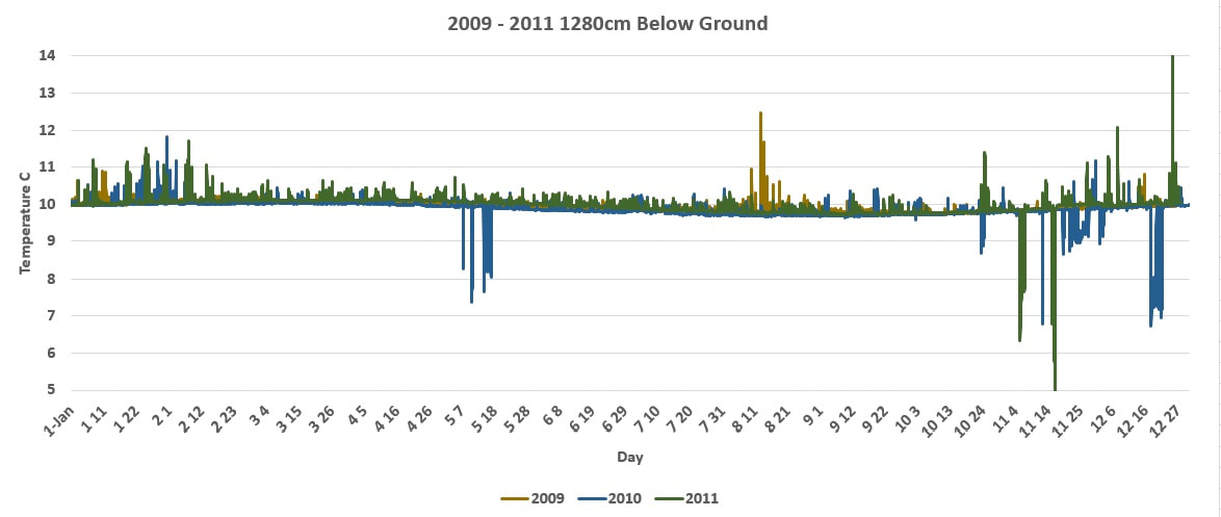
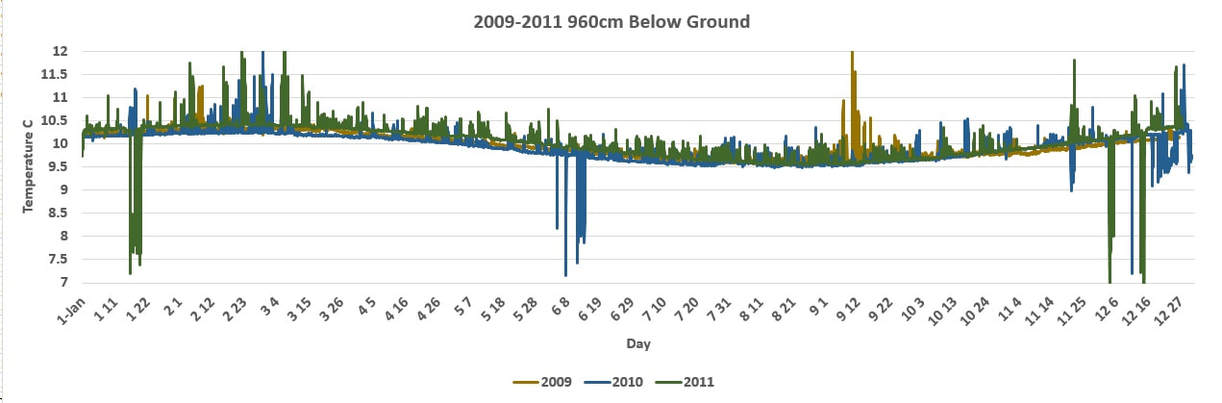
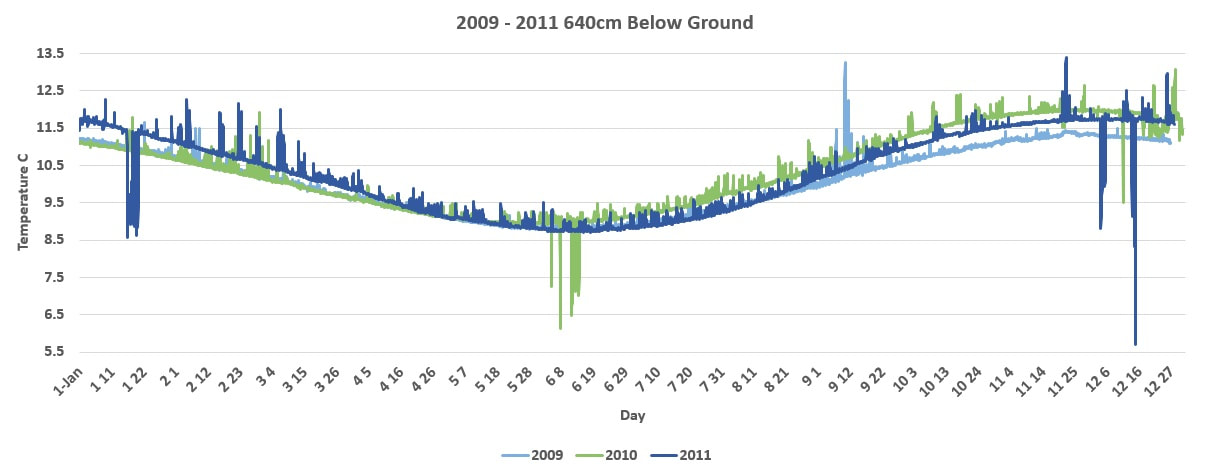
2009 - 2011
Three years later, from 2009 to 2011, the temperature gradients now expand into the 640cm region exceeding the 2000 to 2004 base line, but the 480cm region has still not exceeded this base line for this time period.
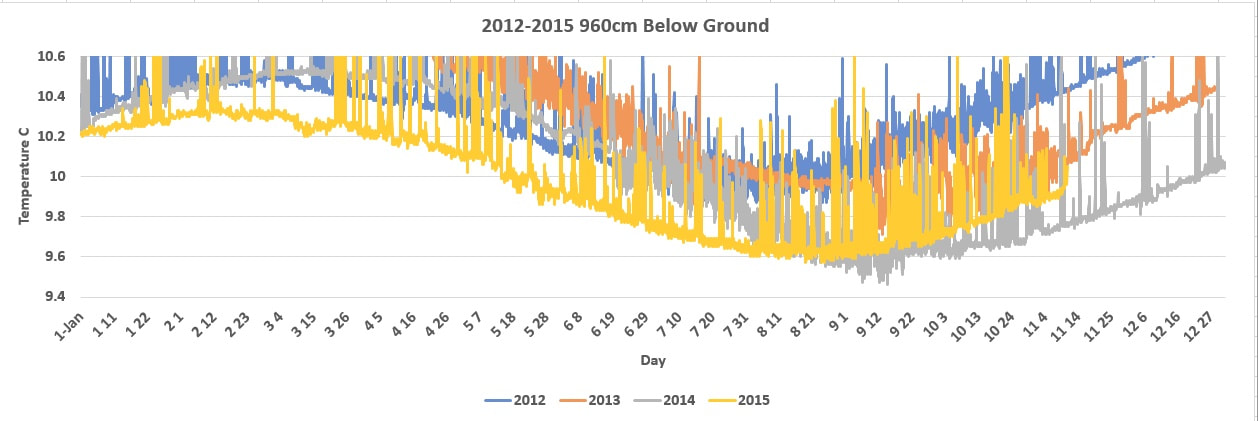
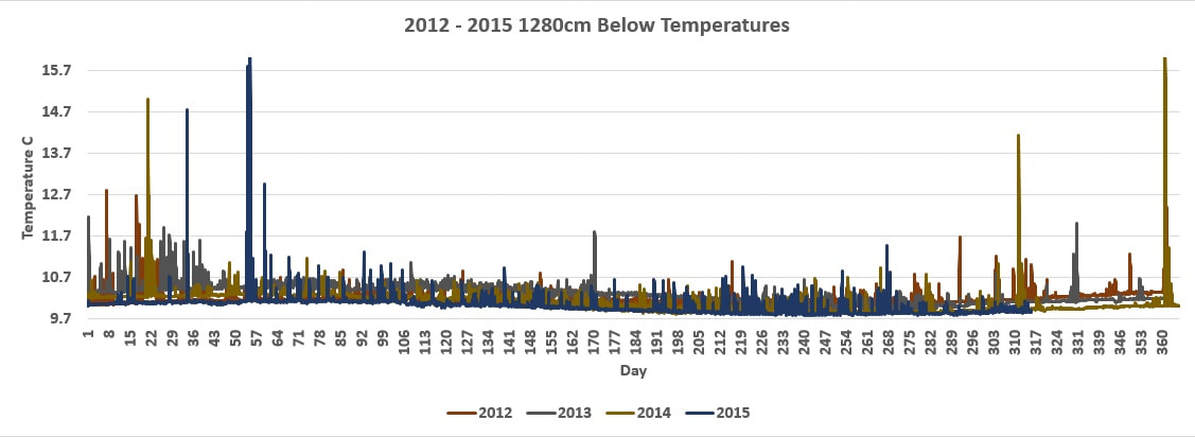
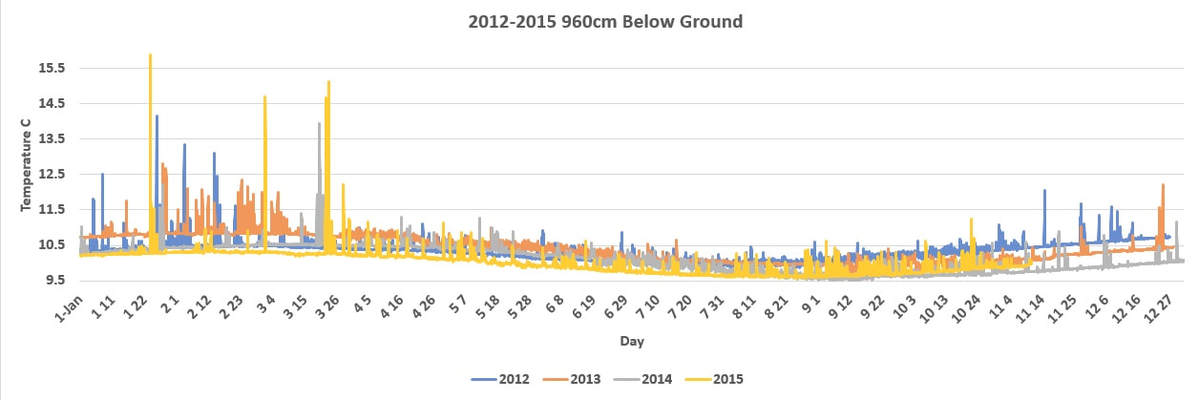
2012 - 2015
In another three years, and beginning in 2012, the cooling associated with the oscillating temperatures ended and only heating occurred. Notice that the primary heating is observed prior to April, and then a more stable level, and then begins to heat again in the fall. This cooling effect corresponds with the "Recharge" event that occurs every spring with the thaw, a period of time when cold fresh water recharges the aquifers filling them with cool fresh water. Once the recharge event ends, the aquifers gradually warm until the next spring when the recharge event occurs again. Because the recharge enters into the lower aquifers and pressure drives it upwards towards the surface into other aquifers from the Rockies and eventually into the territorial aquifers, this heating is being driven from water below the bedrock. Due to the rapid heating that occurred during the 1980's and 90's, it was going to take longer for the water in this region to come to equilibrium with the surrounding bedrock.
In 2015 and 2016 we experienced unusually extended delays while entering into winter across the Midwest, and this year the National Weather Service has reported that we should expect a similar delay this year. This heat, being driven up, is only a couple of degrees centigrade, a very minimal rise in temperatures that people and industries would not be alarmed about, or even notice. This 2C rise coming up today is the total amount of heat that has risen over the past 40 years at an average of only .05C rise per season.