Since the publication of "Decoding Earth's Hidden Secrets," confirmation of the Earth's Thermal Switch was found in the data sets available from the University of Minnesota, St. Paul Campus, Climate Observatory.
Current temperature rise for 2015 is only .87C according to NASA, and the global temperatures have remained above the zero base line since 1977. This is a 38-year period of time with temperatures rising at a rate of .023C every year. Understanding this small rise in yearly temperatures, even temperatures in the hundredths of a degree, will accumulate over time and create a warming effect upon the surface.
Underground temperatures from 2000 to 2014 can be accessed here. The 1963 to 1996 data was attained separately and was based upon the monthly averages. The 1997 and 2015 data was not complete and the 1998/1999 data was not available. If you are not aware of our planets overturn event that switches energy flow, then see The Earth's Thermal Switch to understand this process before continuing.
Underground temperatures from 2000 to 2014 can be accessed here. The 1963 to 1996 data was attained separately and was based upon the monthly averages. The 1997 and 2015 data was not complete and the 1998/1999 data was not available. If you are not aware of our planets overturn event that switches energy flow, then see The Earth's Thermal Switch to understand this process before continuing.
Data Overview
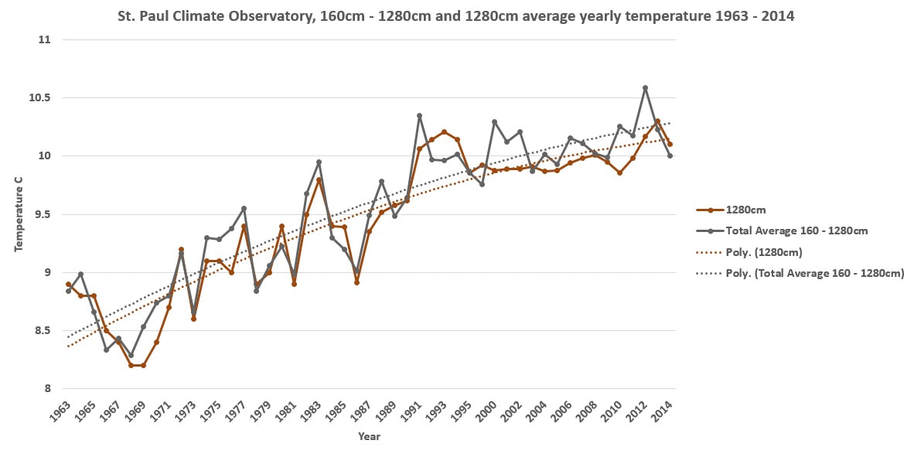
Underground temperatures have been monitored since the fall of 1962, so beginning in 1963, the first full year of data, the average monthly temperatures for the year are graphed out to the right. With the exception of 1997 to 1999 where data was missing, the temperatures were averaged out per year from 160cm to 1,280cm, in at 160cm increments. The average temperature at 1,280cm per year is then averaged out per year demonstrating a rise in subterranean heat capacity.
During the 1960's the overall underground temperatures averaged 8.6C, today they are averaging 10.2C. Heat gain and loss is based upon seasonal lengths and the size of the area affected. The longer the winter and the more wide spread across a plate, the cooler it will become after many seasons by discharging heat at a greater rate than the charging rate. The opposite is also true, the shorter the winter and the less area it engulfs across a plate, the warmer we will get. This is the effect that, overtime, is termed, "Global Warming."
Heat and electricity can be converted to each other, for example, the energy being emitted from the core is rated in watts, the same as electricity, and both can be converted to BTU's as well. They are both measurements of power and Power Conversion Calculators are available online. Just as we charge our cell phones, and then watch them discharge with electricity, the Earth charges and discharges yearly, but uses heat instead.
Conduction and Storage Rates
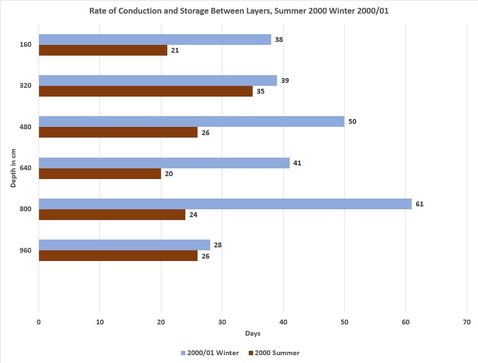
The Earth maintains a fixed amount of resistance to heat within the soils, as all materials do. Within a system that cycles there is both periods of time when heating and cooling offer an exchange of energy. Within this type of system, determining energy flow from one layer to another is nearly impossible due to this energy exchanged between them. Additionally, water allows for convection that can move heat far more rapidly as the following data will demonstrate.
When resistance is fixed within a system, as the earth is beneath the surface, temperatures can only rise due to increased energy. Additionally, in a system that cycles there is a charge and discharge. When the heating cycle lengthens and the cooling cycle declines, the amount of energy will amplify and naturally build beneath the surface. This retained heat creates an overrun effect over time, and with the Earth this is identified by the length, area, and depth of the conduction cycle.
A determining factor in heat flow is not the length of time it takes for heat to rise to the surface but the duration, size, and the depth of these cycles between the layers. By analyzing the data during both the conduction and storage cycle for 2000/01 years this chart was created. This is the number of days it takes for a transition to alter, both heating and cooling. The overall flow rate for the storage cycle from layer to layer was 30 days, and the exhaust rate was 40 days. The reason for this difference is the influence of the additional solar energy on the surface creating a cap on energy flow forcing it to build.
Layers
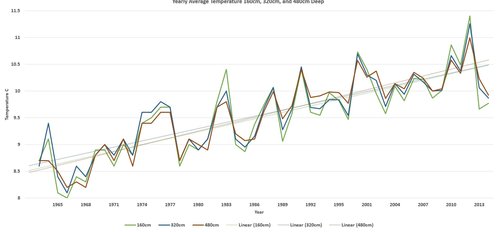
In this graph the upper three layers, 160cm, 320cm, and 480cm are plotted together demonstrating that they remain relatively consistent with one another with the lower layer, 480cm, rising slightly faster. This region is heavily influenced by the surface alterations and seasonal changes. When water lines freeze, the 160cm depth will drop below zero as the water lines are typically 6 feet in depth. Since 2000 the temperatures at this location have not declined to this level. In 1963, 64, 65 and 1968, the average temperatures for an entire month averaged less the 1C.
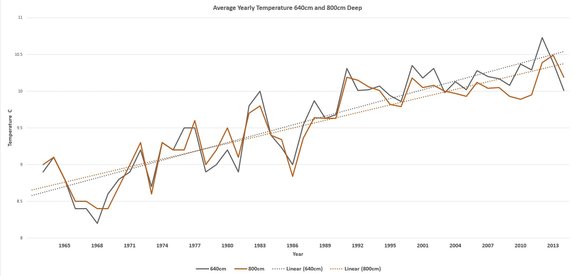
The middle layer at 640cm and 800cm is the transitional layer. These two layers are also influenced by the conduction cycle, but to a lesser degree. In 2000 the conduction cycle had descended down to the 640cm in depth on February 9th and down to the 800cm mark on April 2 and remained locked in for four weeks. In 2012, the conduction cycle at 800cm never locked in and released heat for only four and a half days. Conduction cycle ended on April 3, 2012 due to the increased heat gradients below. The overall average temperature at 640cm is rising at a faster pace than the 800cm layer demonstrating rising heat gradients from below.
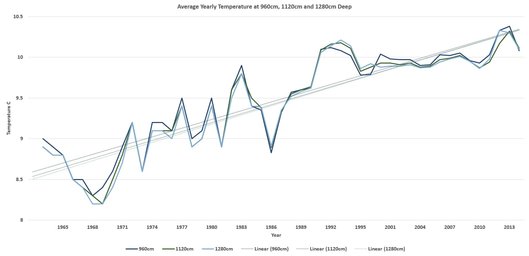
The surface temperatures alter greatly due to many external forces such as the seasonal cycle, volcanic eruptions, solar cycles, or altering jet streams, but the subterranean becomes more stable you descend. At 960cm, 1120cm, and 1280cm, the temperatures have risen together and are coming to equilibrium. This indicates that the energy is equalizing in this region and rising. In 1966 report "Climate of Minnesota, Spring Soil Temperatures" it was reported that this region remained a constant 48F degrees and is now 50F or greater.
Plateau
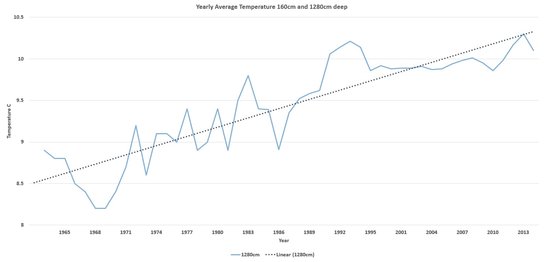
Yearly average temperatures at 1280cm were plotted out from 1963 to 2014, with the exception of 1997-1999. In this graph, after 1991, there is a “Pause” that many agencies have reported in global warming at the 1280cm depth. The maximum temperature at this time is limited to just over 10C at this depth, but this heat will reach its maximum temperatures, and then rise and build towards the surface.
Time is an element of heat storage, the longer it charges, the more energy it will retain. The length of the seasons is a determining factor in surface climates. If there is a plateau, or cooling, it will be able to be identified by alterations in the seasonal length.
Time is an element of heat storage, the longer it charges, the more energy it will retain. The length of the seasons is a determining factor in surface climates. If there is a plateau, or cooling, it will be able to be identified by alterations in the seasonal length.
Increasing Seasonal Lengths
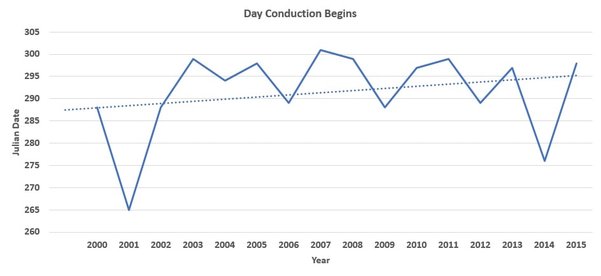
The conduction cycle in Minnesota has had a naturally longer cycle than the storage cycle at 160cm. In the spring the conduction cycle has extended a few days in the spring since 2000, from April 30th to the 27th. Emerging from winter is only slightly altered and still remains fairly constant.
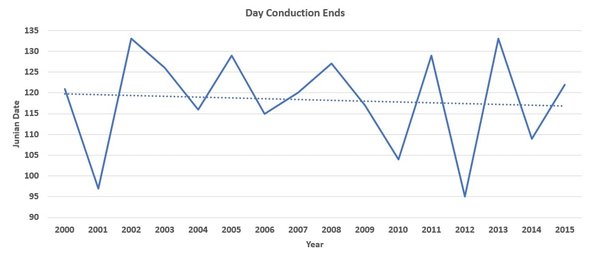
The amount of time the energy being stored and resisting conduction flow in the fall has increased by a week. Once averaging October 14th, it’s now extended by seven days to October 22nd since 2000.
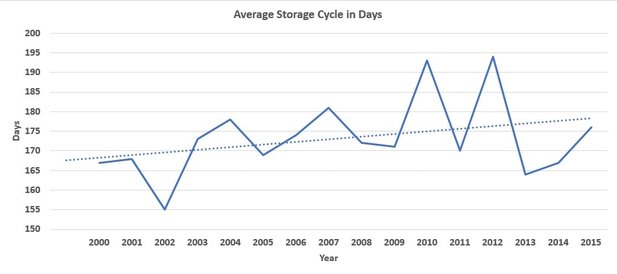
By bringing the upper two graphs together we see a more overall seasonal length. A total increase of 10 days since 2000 is demonstrated in this graph in the conduction cycle at 160cm. Recently, in both 2010 and 2012, the conduction cycle at 160cm beneath the surface was shut down for more than ½ the year.
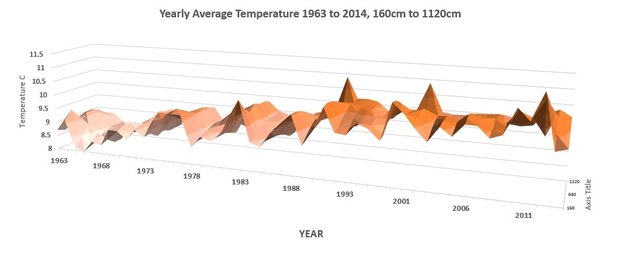
Year by year we experience seasons of warming and cooling with many factors having an influence. When the overall yearly temperatures beneath the surface were plotted out from 160cm to 1120cm, the following graph was created. This demonstrates the differences between weather and climate. The hills and valleys are weather, periods of time when surface conditions alter. The upward trend is climate, long term trends of continual warming.
The Earth Pulsing
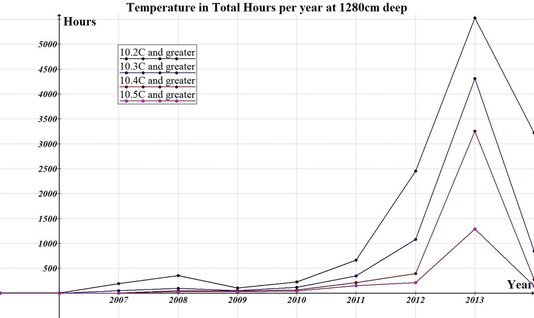
Prior to the fall of 2005, the alterations in temperatures at 1280cm was limited to less than .05C per hour and never attained a temperature of 10.2C. By the fall of 2005 spikes of .1C were observed, and over time the temperature oscillations have risen in frequency, levels, and depths. Using 10.2C as a base line the following graph was created demonstrating the amount of time that temperatures were surging. In 2013, the temperature was registering above 10.3C for nearly half the year, and was 10.5C for more than 53 days.
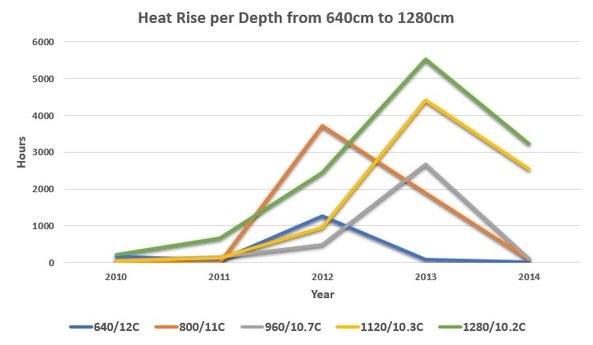
From 2000 to 2004 the following temperature plots were never recorded, 12C at 640cm, 11C at 800cm, 10.7C at 960cm, 10.3 at 1120cm, and 10.2 at 1280cm. As you rise closer to the surface, the greater the temperatures oscillate between seasons.
Records indicate that in North America, 2012 was one of the hottest years on record. By plotting these temperatures, we can see the separation between these layers. The surface heating of 2012 had a direct effect upon the 640cm and 800cm region during that year, but a delayed effect in the lower regions as they continued in an upward trend of heating through the following year. Additionally, the cold winter of 2013/14 had a minor effect on the 1120cm and 1280cm region in 2014 in comparison to the major effect upon the upper regions, including the 960cm region.
Records indicate that in North America, 2012 was one of the hottest years on record. By plotting these temperatures, we can see the separation between these layers. The surface heating of 2012 had a direct effect upon the 640cm and 800cm region during that year, but a delayed effect in the lower regions as they continued in an upward trend of heating through the following year. Additionally, the cold winter of 2013/14 had a minor effect on the 1120cm and 1280cm region in 2014 in comparison to the major effect upon the upper regions, including the 960cm region.
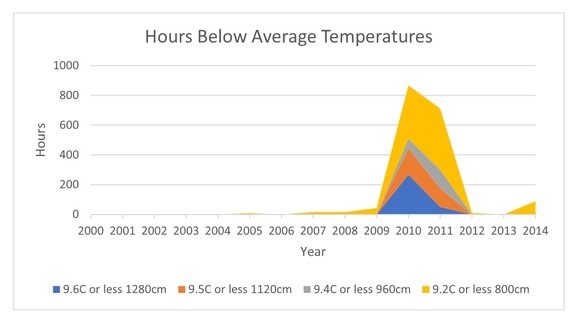
Within these oscillations there were cool surges demonstrating that these oscillations were coming up through the water. Low temperature minimums for 2000 to 2004 were used as a base line to determine the impact of this cooling at various depths. The temperatures never dropped below the following; 9.2C at 800cm, 9.4C at 960cm, 9.5C at 1120cm, and 9.6C at 1280cm. This chart demonstrates the level of cooling. These surges were directly associated with heating surges registered in other levels.
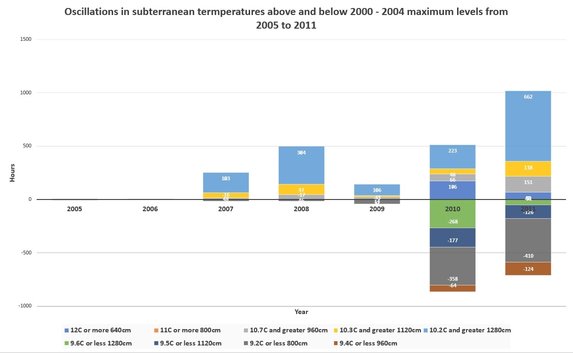
Because there is both cooling and heating, the alterations at various depths were charted. The overall effect was measured in hours between 640cm to 1280cm in depth from 2005 to 2011. This demonstrates the overall average temperature oscillations, heating and cooling trends. Although 2007, 08, 09 demonstrated a warming effect, 2010 and 2011 balanced this out. In 2012 this changed.
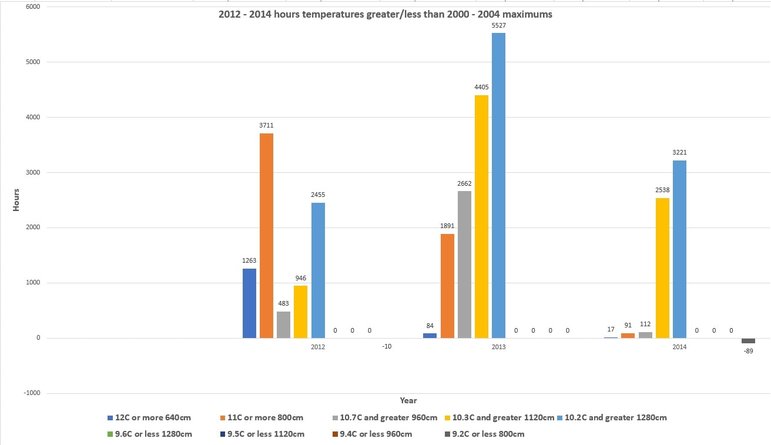
The conduction layer impacts the layers down to a depth of 800cm. At depths, greater than 960cm, the temperatures remain relatively stable.
This chart indicates that this heat is surging from the deeper layers upwards, and the cool surges associated with these surges of heat have drastically dissipated. The heating of 2012 had an impact on the 2013 heat gradients affecting all the layers beneath. The following winter season was very cold and had a direct impact on the layers down to 960cm, but both the 1120cm and 1280cm levels maintained much of their heat.
This chart indicates that this heat is surging from the deeper layers upwards, and the cool surges associated with these surges of heat have drastically dissipated. The heating of 2012 had an impact on the 2013 heat gradients affecting all the layers beneath. The following winter season was very cold and had a direct impact on the layers down to 960cm, but both the 1120cm and 1280cm levels maintained much of their heat.
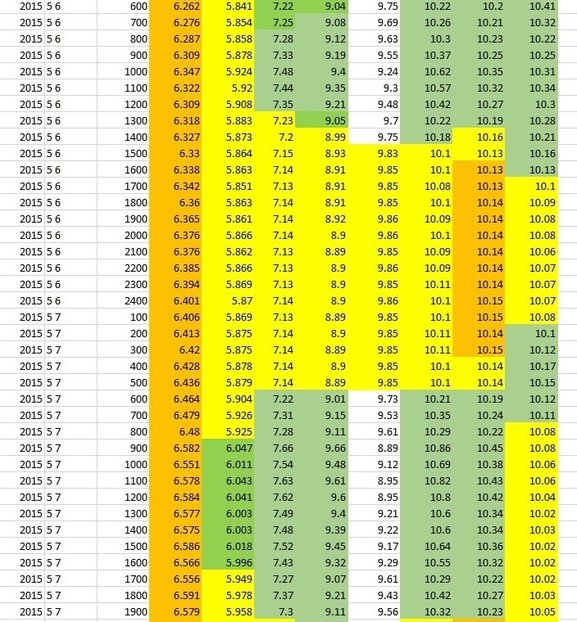
Graphs and charts up to this point have demonstrated heat flow direction, so a separate chart was compiled to see the heat pulsing. Using the hourly variables prior to 2005, additional anomalies were colored green for heat and no color for cooling that altered greater than previous years. The left column is 160cm deep and they increment 160cm per column to a maximum depth of 1280cm. This graph, from May 6th and 7th, 2015, indicates that the heat is continuing to pulse upwards and averaging more than .5C, and sustaining over longer periods of time and influencing shallower depths. The cooling effect is continuing to pulse up towards the surface but no longer drops down to previous low temperatures.
These spikes are both strong enough and long enough to be pulsing into the area lakes, swamps and rivers. This energy will naturally resist the onset of the frost and ice cover resulting in a longer delay for winter, and a more rapid thaw in the spring. Additionally, it will create a feedback onto itself. As the heat rises the conduction cycle will decline causing an acceleration of heat resulting in rising heat gradients over time.
Confirmation of Geothermal Effect upon Surface Temperatures
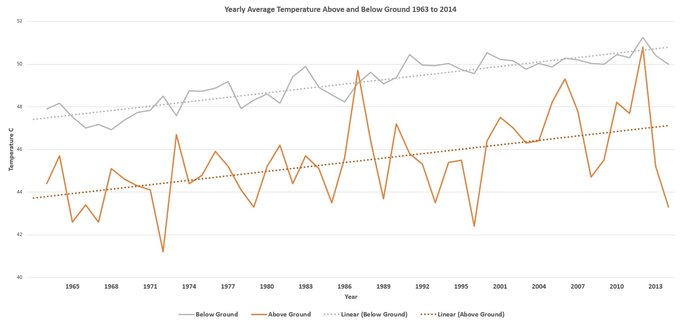
By adding together all the underground temperatures during a given year from 160cm to 1280cm in depth, intervals of 160cm, 8 data sets, the average yearly temperature was calculated since 1963. Using this data and the annual surface temperatures from the Twin Cities International Airport, the following graph was created demonstrating the direct impact that the subterranean layers have on the surface temperatures. These two separate stations, with different teams, equipment, and records, are located 9.1 miles apart by road on separate sides of the Mississippi River. Their underground temperatures from 2000 to 2014 can be accessed here. The 1963 to 1996 data was attained separately and was based upon the monthly averages. The 1997 and 2015 data was not complete and the 1998/1999 data was not available.
As this graph indicates, the temperatures above the surface are directly connected to the rising underground temperatures. Any deviations from these two points would have to be attributed to external forces, but the surface temperatures cannot be less than the rising subterranean heat. It would be a violation of the basic laws for the atmosphere, which is cooler, to heat the ground to a temperature greater than itself. With the exception of 1987, this confirms the ground is heating the air and loosing, on average, 4F between 160cm and the thermometer on the surface, primarily by the atmosphere.
The sun, core, axial tilt and atmosphere are all needed for this to occur. The sun and core both apply the heat, while the atmosphere resists the flow and aids in maintaining this heat throughout the night. When the axial tilt decreases the hours of sunlight, the atmosphere looses too much heat throughout the night we alter into winter.
At 1280cm in depth, the temperatures alter from one year to the next and have never been recorded rising more than .5C, and never declined more than .6C from one season to the next. Although generally stable, an overall incline continues. The average temperatures at 1280cm from 1963 through 1969 was 8.54C, and from 2008 through 2014 this had risen to an average of 10.05C, a 1.51C rise. The overall temperatures from 160 to 1280cm was 8.56C for 1963 through 1969, and today are averaging 10.16 from 2008 through 2014, an overall average increase of 1.6C.
Research and analysis of the 2013/14 cold winter gives as an opportunity to be able to both monitor and measure this heat and can be accessed here.