|
Earth's Thermal Switch, the Driving Force Behind Climate Change is now available online for review at:
https://www.omicsonline.org/open-access/earths-thermal-switch-the-driving-force-behind-climate-change.pdf
0 Comments
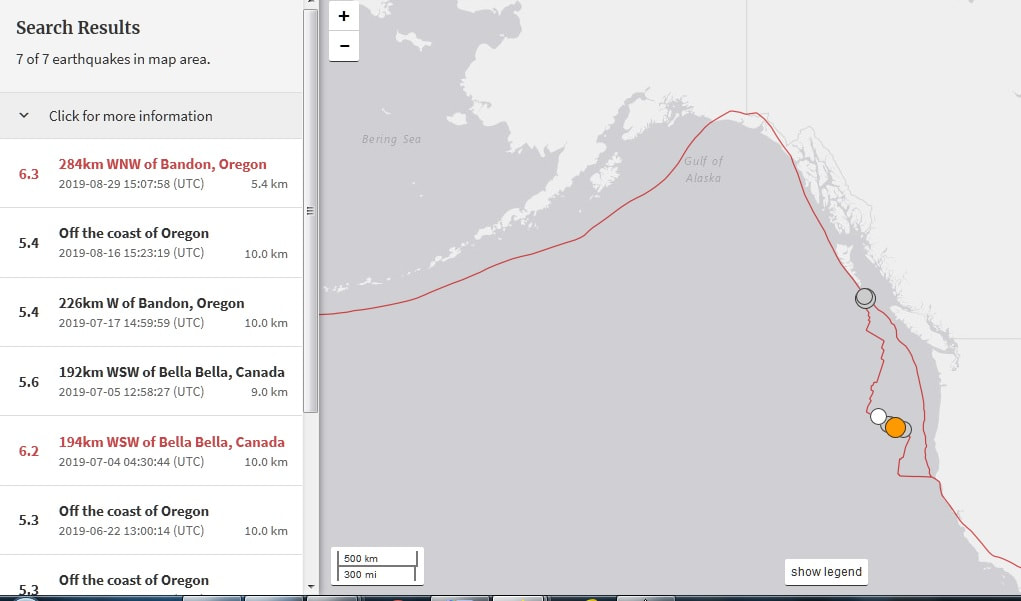
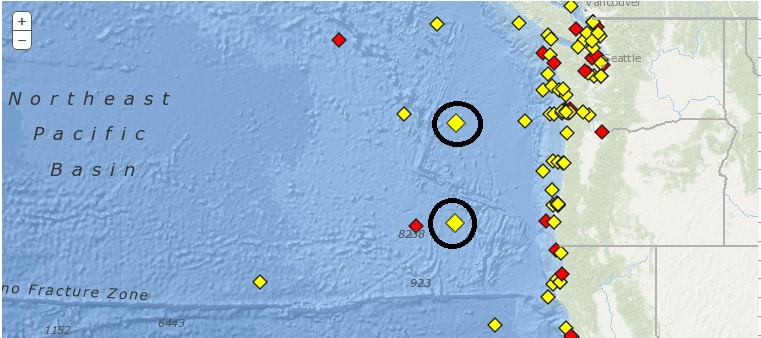
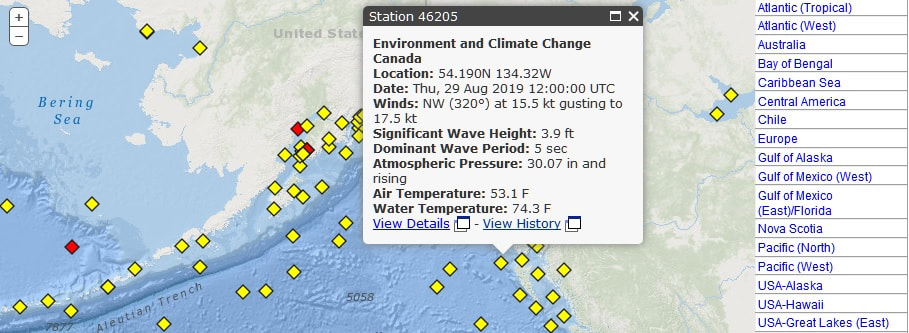
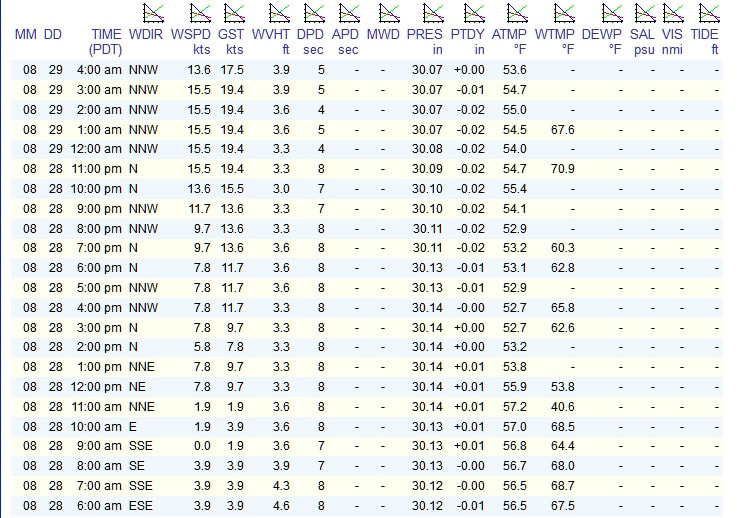
Yesterday a magnitude 6.3 hit off the coast of Oregon and today there are wave warnings out for two buoy's off the coast. In addition to this event there was a marked location where a buoy #46205 was picking up extremely warm temperatures often seen with deep sea volcanic activity. A warm Gulf will bring in another year of snow and cold for North America, but delayed for many regions due to this warmth slowing the onset of winter. But do expect increased precipitation again this fall, not good for the farmers.
Today the Journal of Earth Science and Climactic Change is publishing my 9 year long research paper on our world's "Thermal Switch." When available on line I will make it available.
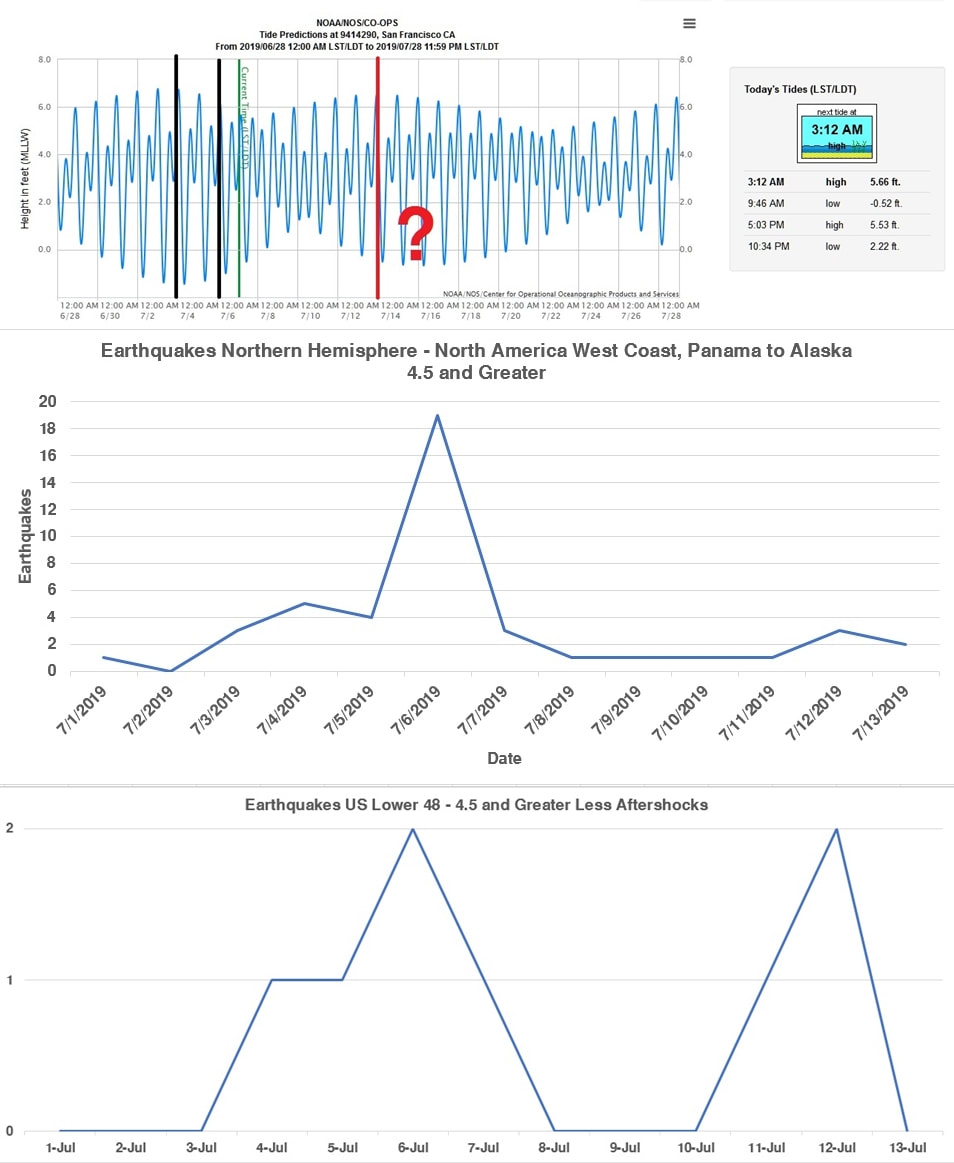
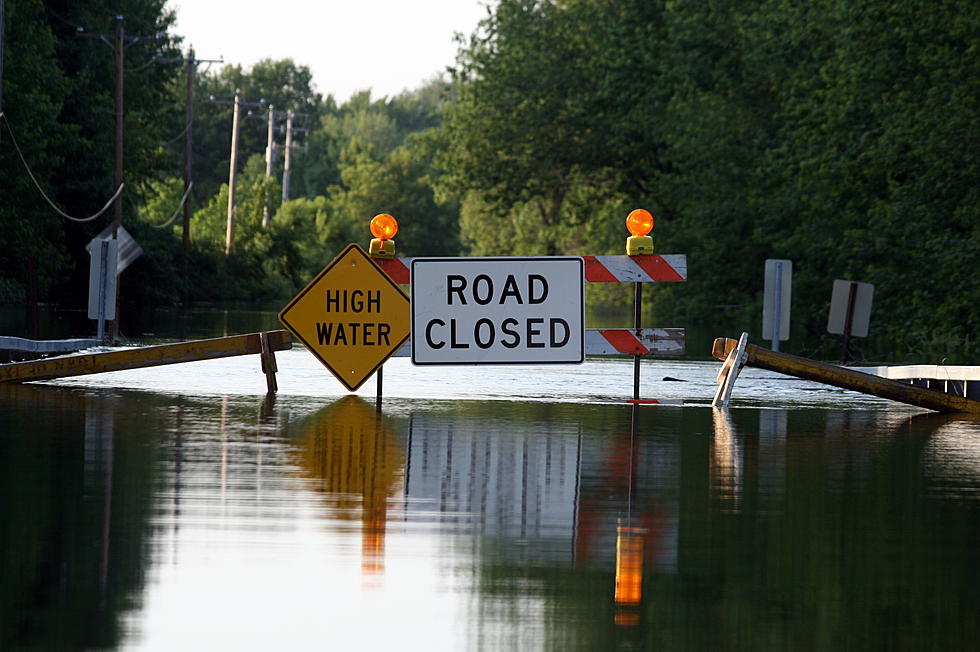
The incoming hurricane rolling into Louisiana is going to create a greater water event than Katrina. The storm is project to travel up the Mississippi and will cause the river to rise for a long period of time and threaten levees. California last week had a swarm of earthquakes. Researching this swarm I found a potential link between tidal weight and earthquakes. Here is the charts I created and the question mark places this at this time peaking on Monday. We are only 5 hours into the 13th with 2 along the coast already.
Earth’s Thermal Switch, the Driving Force Behind Climate Change
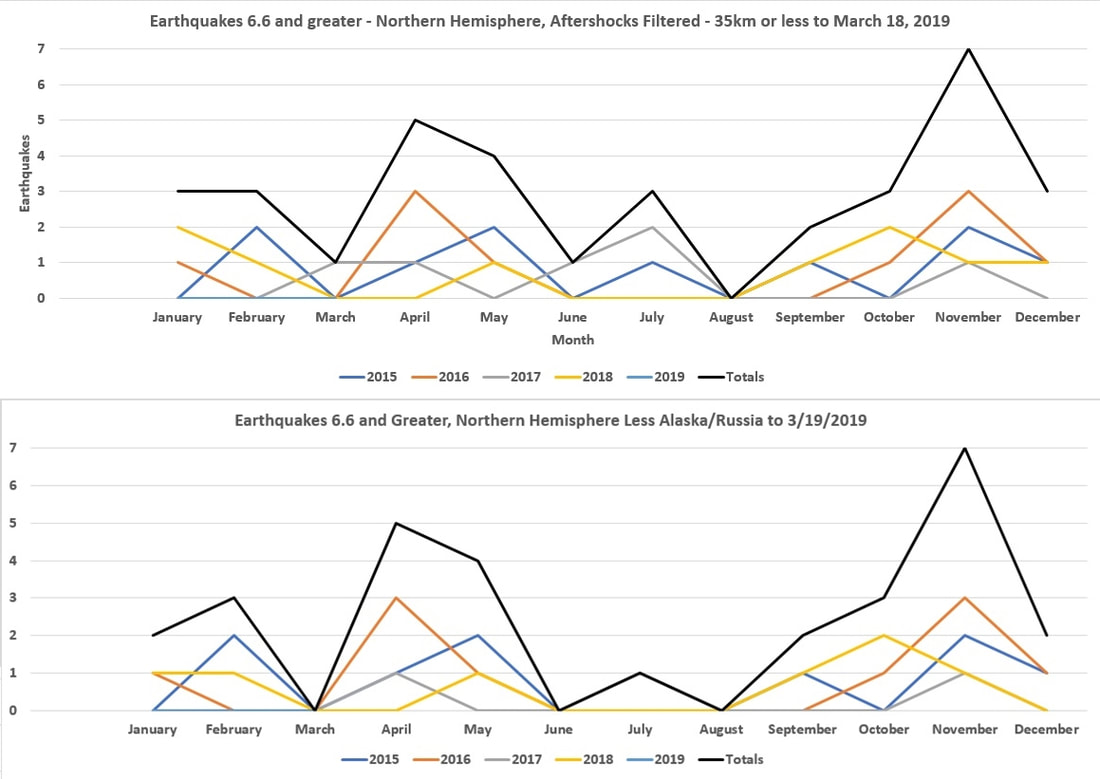
Abstract There has been an accumulative amount of data demonstrating that our world is warming and climates are shifting, but the cause and source remains speculative. Thermodynamic laws, in conjunction with data analysis, demonstrates that the Earth heats and cools through long-term oscillations in underground heat flux warming our world to a level greater than the sun alone can account for. To confirm the impacts of this event, an Earth Simulator was created to reproduce the heat flux at these depths beyond 30 feet. Acting as our planet’s secondary heat source in this process, the sun, in conjunction with the axial tilt, increases the amount of energy upon the earth creating an “overturn” event of energy. This generates our planets thermal switch shutting down and reversing energy flow into the Earth forcing upwelling heat to build and is a natural form of energy conservation. Recreating the overturn event in a controlled environment demonstrates how increased surface heat increases subterranean heat through energy exchange over time, and how human altered land increases heat flow warming our world. It allows us greater insight into the importance of water and how it both retains and moves heat within the system, and how the soil aids in retaining this energy by resisting the flow of water. Using time and depth as a unit of measure, a means to determine the yearly gain/loss per season can be attained to assess yearly alterations. Soil temperature data can be measured, evaluated, and then alterations to our environment can be implemented to amplify cooling. Current policies and proposals set forth around the world to combat climate change are addressing the after-effects of this heat, not the source. We live within a finite world and adaptation of the natural habitat has its limits that we have surpassed. Until we make serious changes in our lives to adapt for the needs of our world, our current trends will continue to amplify. Earthquake warnings to begin mid-April. In this graph 6.6 and larger earthquakes at 35km or less are plotted for the Northern Hemisphere since 2015. This cycle was identified going back in historical records, so I am keeping up with the research yearly now. Aftershocks are removed from the count and a total of 35 have occurred so far. Alaska and Russia have a slightly different schedule so these are removed in the lower graph. From April 15 to May 18 (33 days), and October 22 to November 25th (34 days), 19 out of 29, or 2/3 of all large scale earthquakes occurred during these brief periods of time. During this period the continental plates undergo shifting due to the heat causing pressure and expansion, so smaller scale earthquakes escalate in numbers as well during these times. In this graph I adjust our worlds earthquakes to our planets clock excluding Alaska and Russia. This comes to 67% occurring during a 67 day period of time.
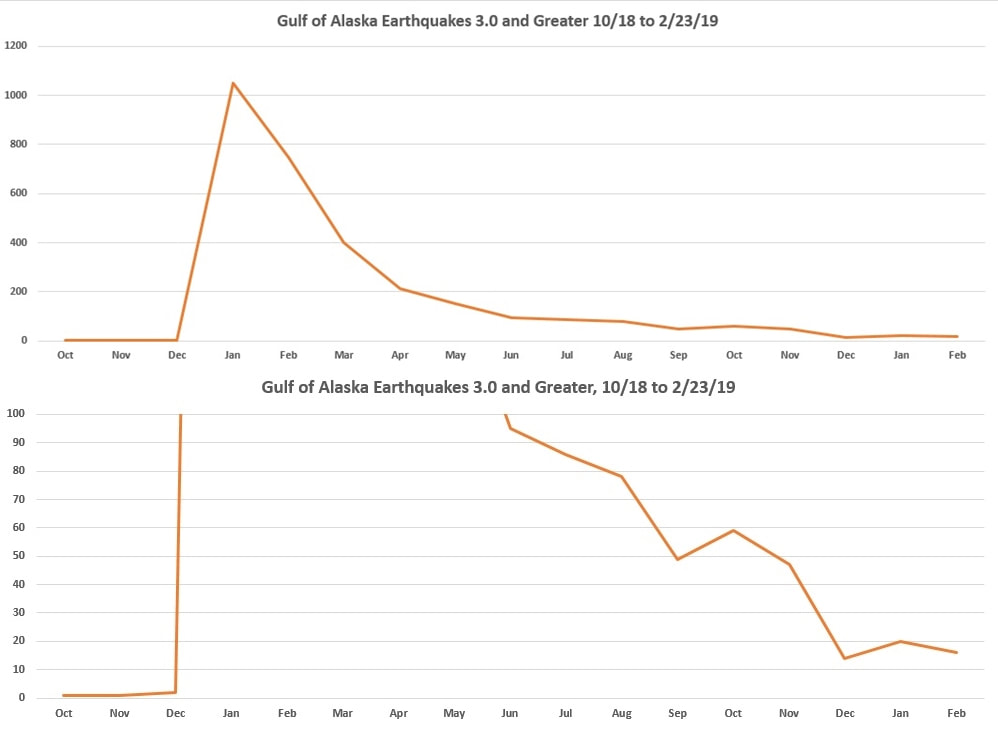
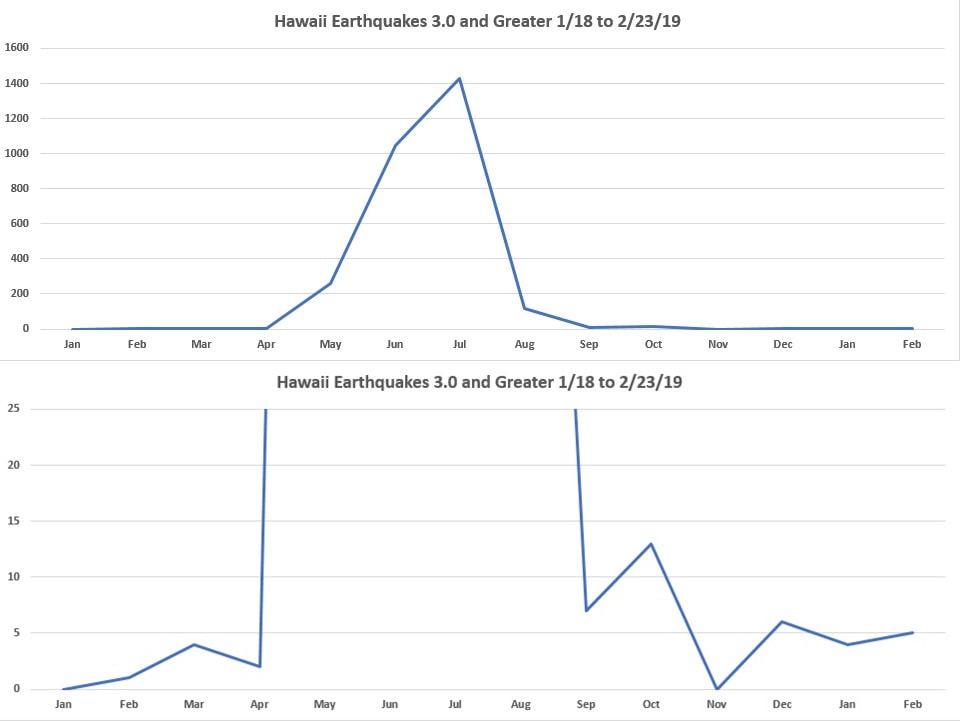
If your wondering where our snow and winter is coming from, here it is. Earthquakes and Volcanoes work together, but deep sea eruptions can not be monitored visually, but their condition can be assessed through earthquake data. Volcanoes erupt releasing massive amounts of pressure, and later they settle down and often seal. Due to the destabilization, they can easily erupt again but usually takes time to build in pressure, and sometimes they just continue to flow, like Hawaii. This is also demonstrated by the number of earthquakes before and after the event. These are two of many regions expelling massive amounts of heat into the Pacific Ocean impacting our weather short term. Hawaii has settled down, while Alaska still rumbles but is demonstrating a slow decline. Expect the SW of the US to heat up this year!
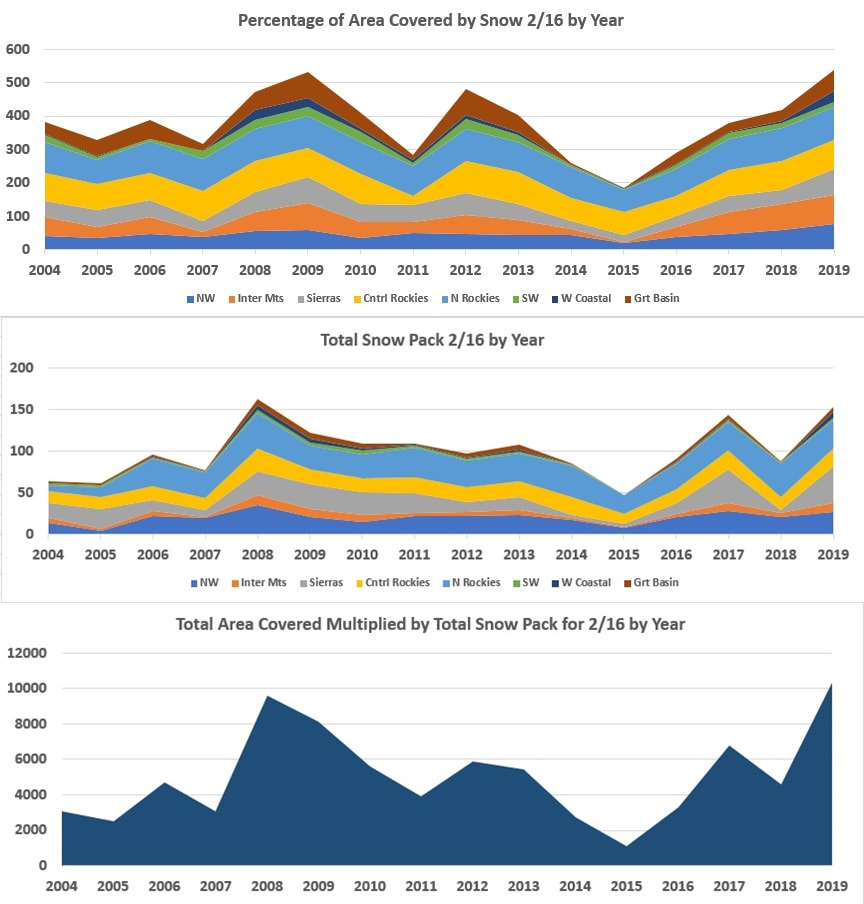
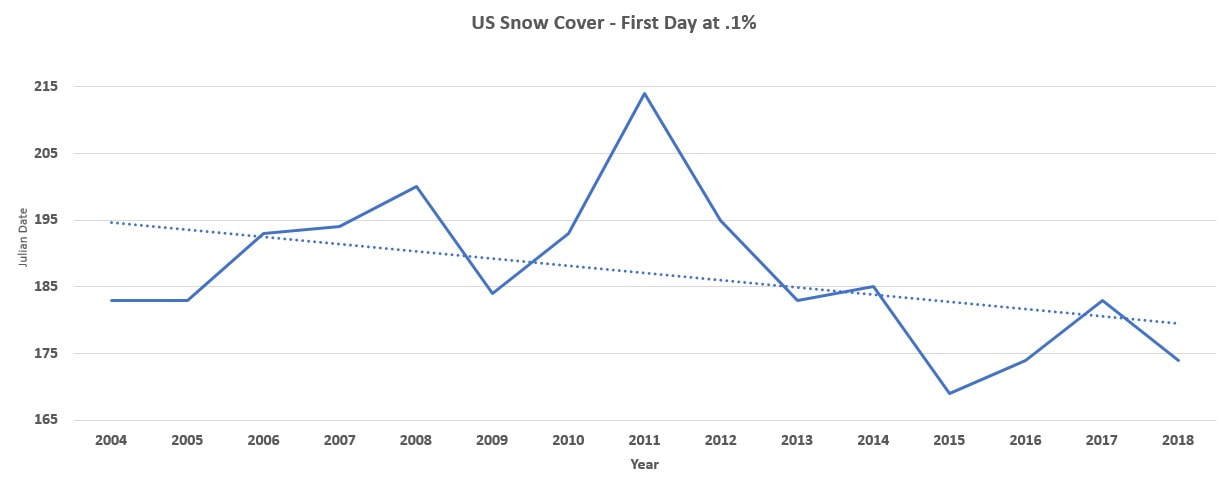
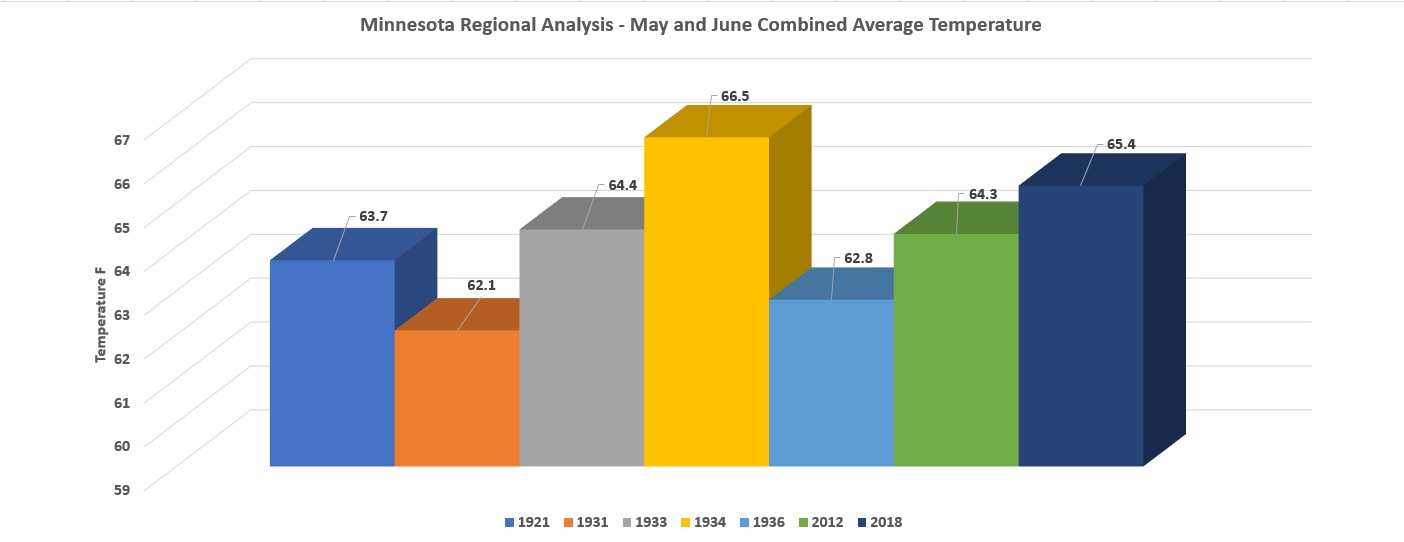
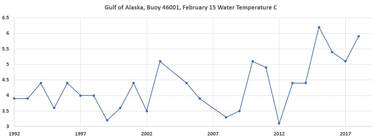 The Gulf of Alaska is a primary force providing the North American Continent with precipitation. I have been keeping track of buoy 46001 and current temperatures on 2/15/19 are the average temperatures once experienced in May, 3 months premature. This is promoting the snow like last year, and the longer it stays on the ground the longer the spring melt is delayed keeping lower than normal surface temperatures, last year we hit record heat when it lifted in May and June. In 2015, the only year that exceeded current temperatures, the heat and drought spread during the summer to the SW, along with fires. Last fall I had reported that the warm ocean current would bring in massive snow pack into the Rockies resulting in massive flooding this spring, the size of the flood can now be compared to previous seasons. The snow pack in the Rockies is at an all time high since recording began in 2004, and this includes the 2008 great flood. Our current snow pack is going to increase the local water tables, and all of this snow will find it's way towards the Mississippi. With the exception of the US SW region, all regions out west are above average levels, and some bursting. Here are all 8 regions out west and all of this will be heading east within the next few months. There is no way around it, it's a tsunami scale flood on the horizon. What is going to make this season worse than 2008 is that since 2013 the snow pack in the Rockies is dissipating at a far more rapid pace, meaning more water at a faster pace. This graph demonstrates the first day when snow pack reaches .1%, which is the last remaining snow in the Northern Rockies and is now melting 2 weeks earlier than previous years. When the air temperatures rise over the Gulf of Alaska, precipitation will decline as it did in 2015, but not until. The current North America snow pack is going to maintain a cool atmosphere short term, but by the end of April we will begin to see the showers and water levels rise. Last year we followed a similar pattern, but was followed by one of the hottest May and Junes on record. In the chart below we can see how May and June stacked up against other years across the entire state of Minnesota.
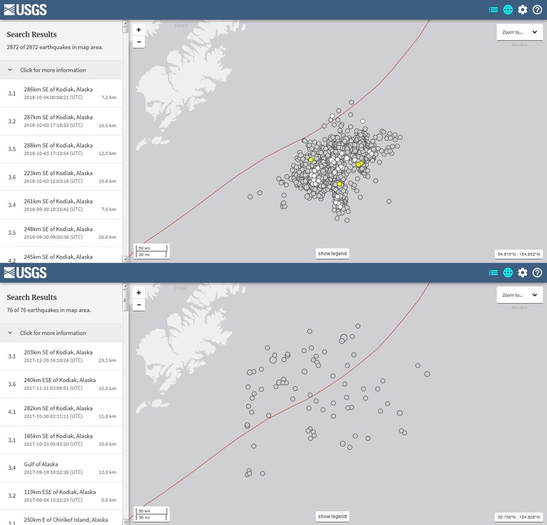
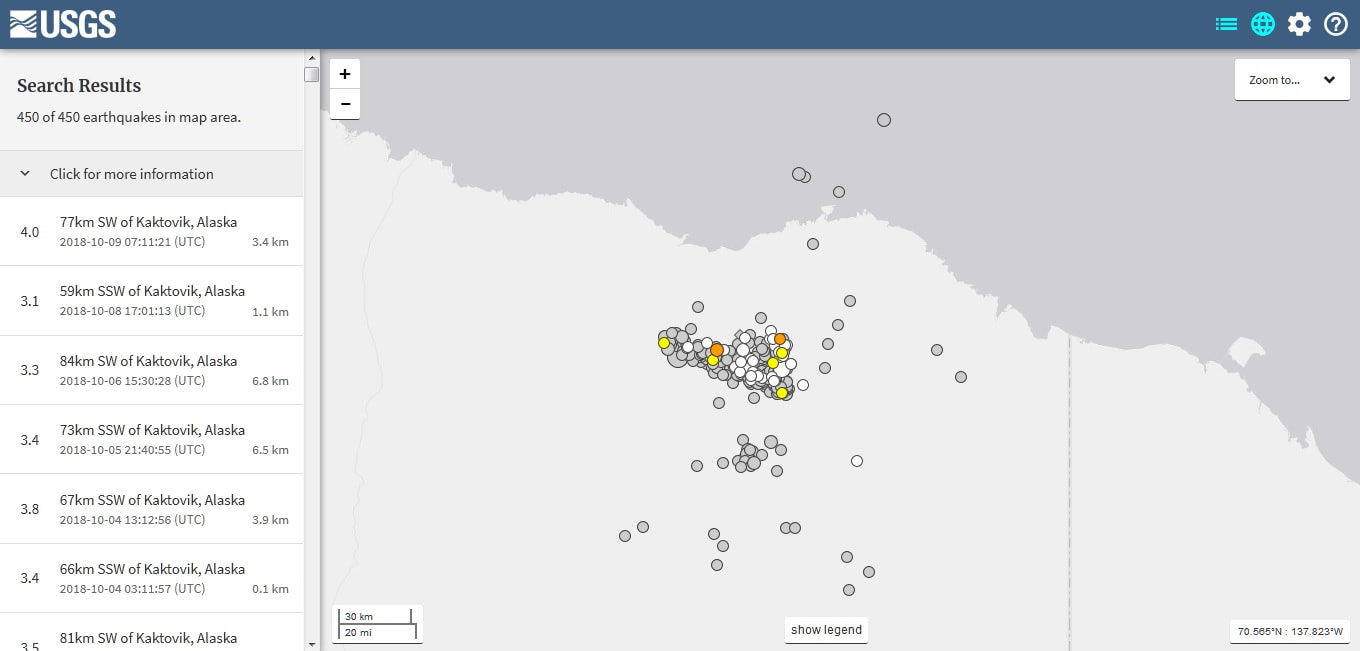
This region erupted January 23rd and the heat was registered by a nearby buoy. This is a confirmed volcanic event that continues and will increase as the plates contract going into winter. From 2000 to 2017 there were 76 level 3 earthquakes, this year alone there has been 2,872. This will delay the onset into winter but the heated surface water will generate massive water vapor as the cold air compresses. This will then drive inland massive snow creating the potential for a cold snowy winter and a very high probability of flooding in the spring. 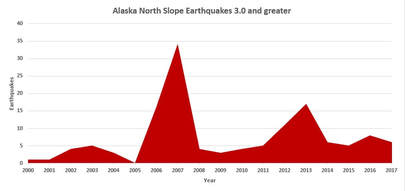 In this graph we can see the historical activity of Alaska's North Slope. Earthquakes began in August at an escalated level with 450 recorded to this date and is demonstrated in the USGS image below. The two regions are on opposing edges of a ridge and both Fairbanks and Anchorage are in between. As the plate cools over the next few month the potential for both earthquakes and volcanic activity increases. |
Archives
September 2019
Categories |

 RSS Feed