|
Just assembled this image of graphs so we can observe the impact that the continental plates and land masses, including Islands and ridges have on ocean temperatures. This in turn drives our weather. The top 3 graphs are the equator in the Pacific, top is off the continental plate of Australia, the next is in the center of the Pacific away from plate boundaries, the third is along the North America Coast. They were just deployed last year so historical data is limited. Overall temperature gradients are identical in all 4 graphs. Deployment dates and technical difficulties on one alters the time frames but overlapping times demonstrates a vast difference. The directional flow of our world is from west to east, and so is the heat, as well as the cooling. As the heat flows away from Australia it is dissipated by mass, and the cooling in the third graph demonstrates the influence of the axial tilt, directional flow and elliptical orbit has as the southern hemisphere enters into winter having a greater impact than the northern hemispheres summer as the Earth travels further away from the sun. The last graph is Hawaii 690 miles further north that demonstrates heat permeating from this region where volcanic activity is common. 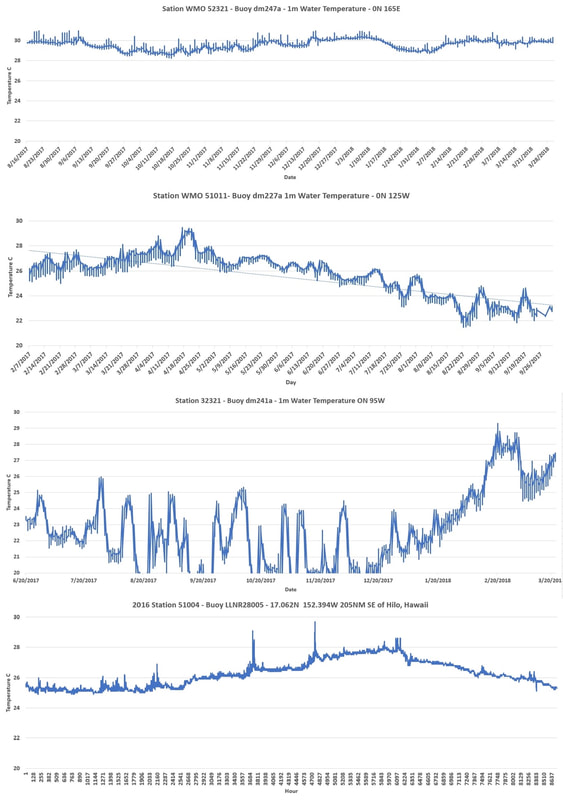 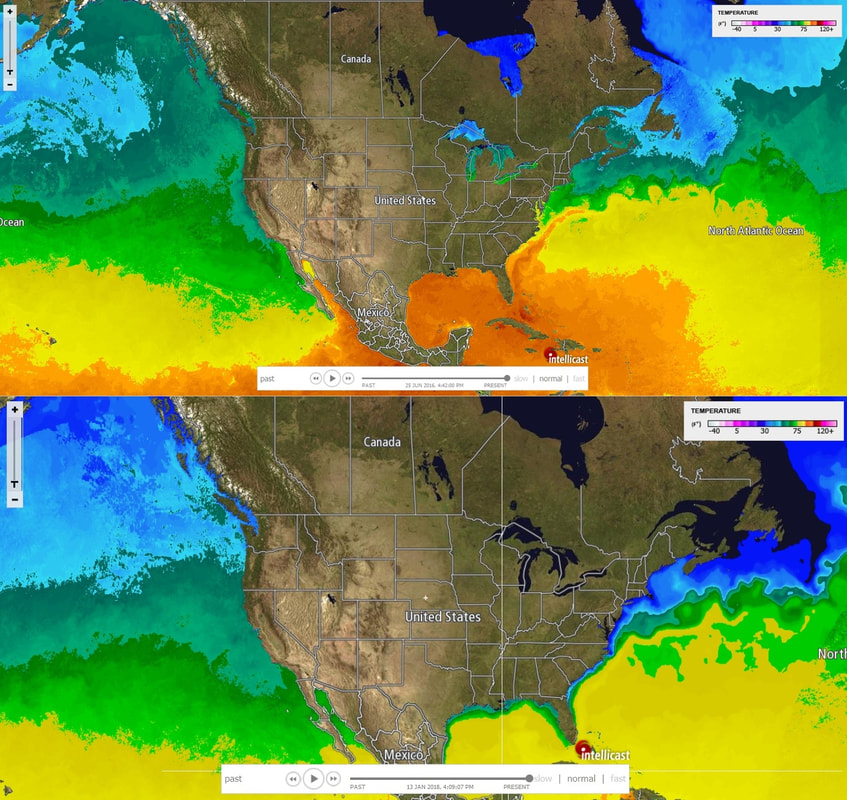 This bleeding effect of both heating and cooling is demonstrated in the ocean temperature differentiators between the coastal waters in the image above. During the summer in the upper image the heat is flowing east into the Atlantic while ocean temperatures along the Pacific remain much cooler. During the winter, in the lower image, the opposite occurs cooling the Atlantic.
0 Comments
You have a cup of coffee that has attained equilibrium with your room at 70 degrees. How do you heat the coffee without raising the room temperature? Can you inject enough CO2 at room temperature to heat your coffee above 70F? The law states that one environment cannot heat another to a temperature greater than itself, and we all know that our cool coffee will NEVER reheat on it's own, it violates the law and common sense. The same hold true for the oceans. Sea surface temperatures at buoy 44001 was analyzed for all the years where full data was available for both sea surface temperature 1m below the surface and air temperature 3m above. Sea Temperatures averaged 7.54C while the air was 6.54C demonstrating heat flow from the water to the air, even in the Gulf of Alaska it flows from the surface up, not down. CO2 cannot generate heat, or violate the laws of convection, your cold coffee is evidence of this. 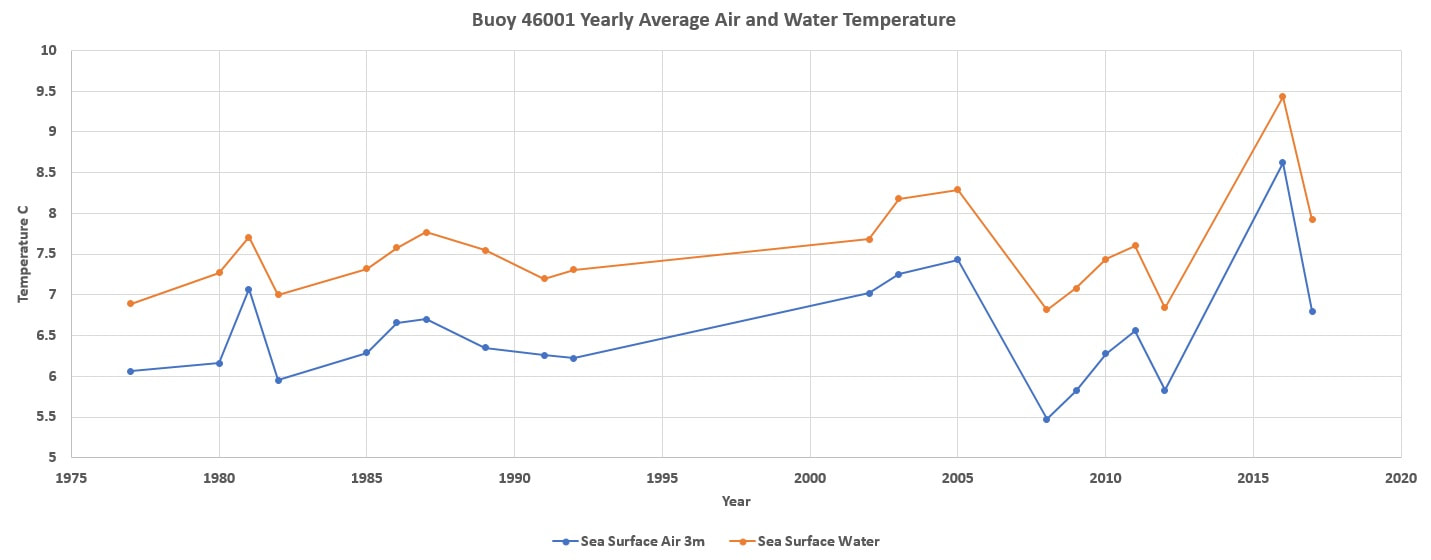 I was reminded today about the blizzards across Europe in 2013, so I took the night researching. I found Buoy 44008 64NM SE off Nantucket available. Buoy was out from March 2013 until mid January of 2015. This is not unusually in researching these buoys but the data demonstrates the same effect as my past post, but further south. The graph compiled all data available since 2012. In 2013 increased earthquake activity was registered in the North Mid-Atlantic Ridge in the upper image, the lower image is the Reykjanes Ridge that is more active today. In 2013 the water temperature was 68F out at sea, and warm water meeting with cold air is the forcing behind this past event, much like today. Here is a link to March of 2013 in Europe. 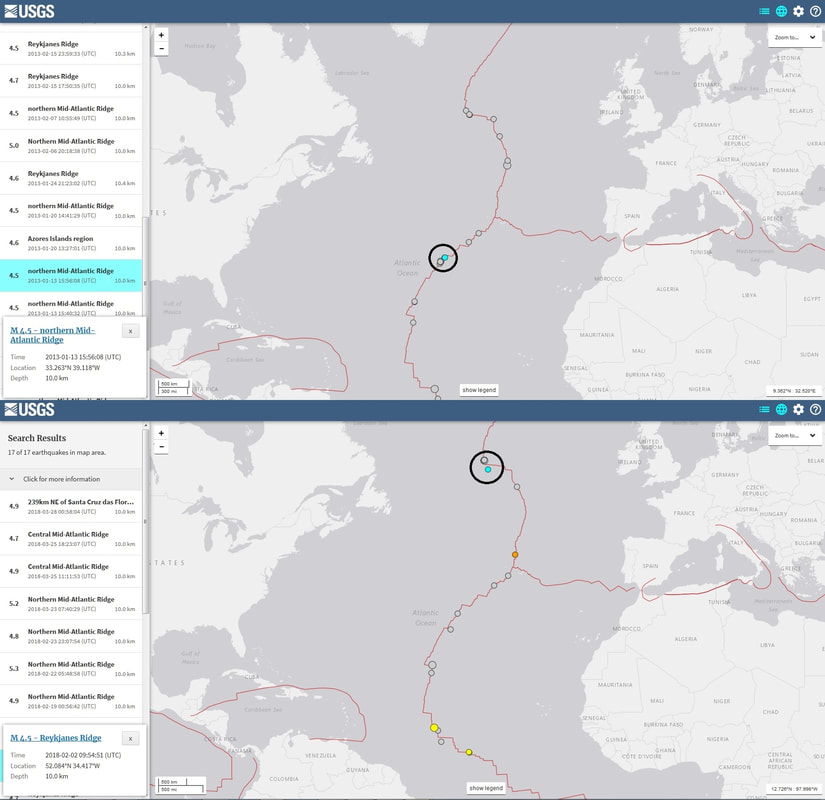 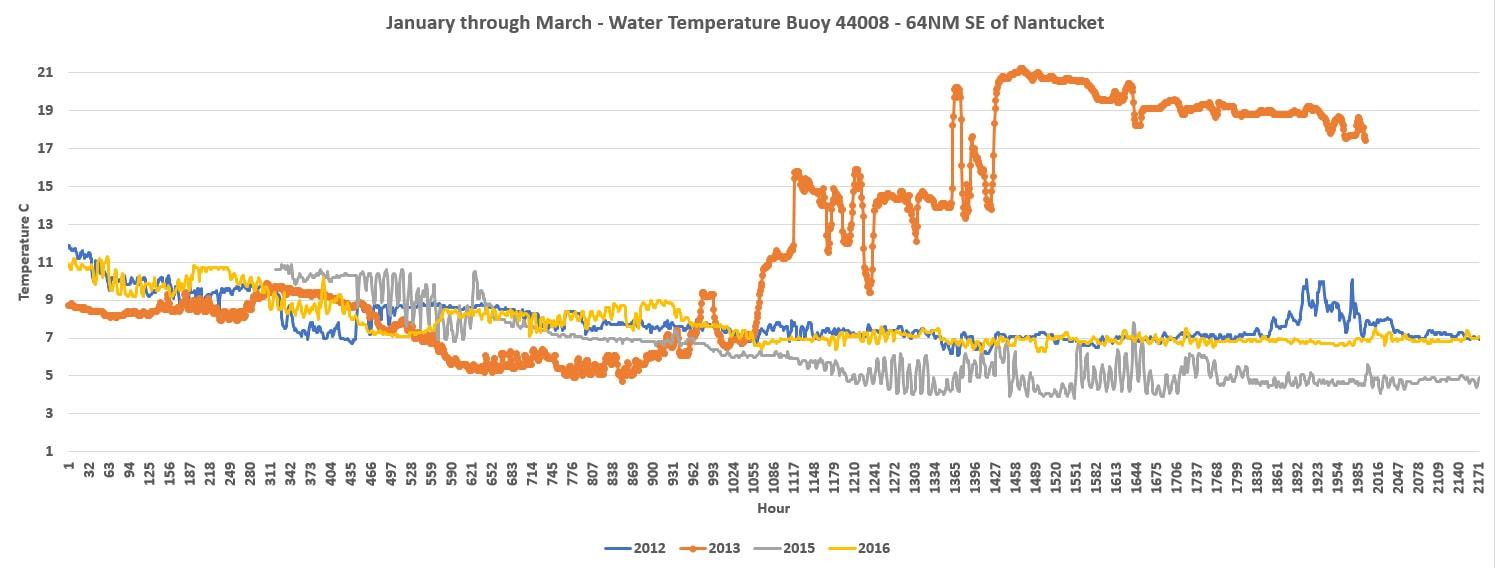 Buoy 46006 located 650NM west of Eureka, CA and 1,234 miles S/SE of buoy 46001 in the Gulf of Alaska was analyzed for a rise in sea surface water temperature. Both buoy's are located in depths over 4km deep and monitor sea surface temperature 1m beneath the surface. The difference in the hour readings in the following graph is that 46006 reports in every 10 minutes, and 46001 reports in once an hour. We can see a rise in sea surface temperatures at buoy 46006 just after a week of the initial surge recorded on 46001. The second spike in the upper graph is the 7.9 earthquake, and I spiked the lower graph for visual perspective of time. This is evidence of geothermal heat being a major contributor to our oceans. This increased heat increases water vapor that accumulates into clouds and rain cooling the surface inland. This also demonstrates, through mass dissipation, that our oceans are natural chilling towers for a huge nuclear reactor that we call the "Core." This in turn becomes the major driving mechanism for cloud cover and precipitation that drives our climates. 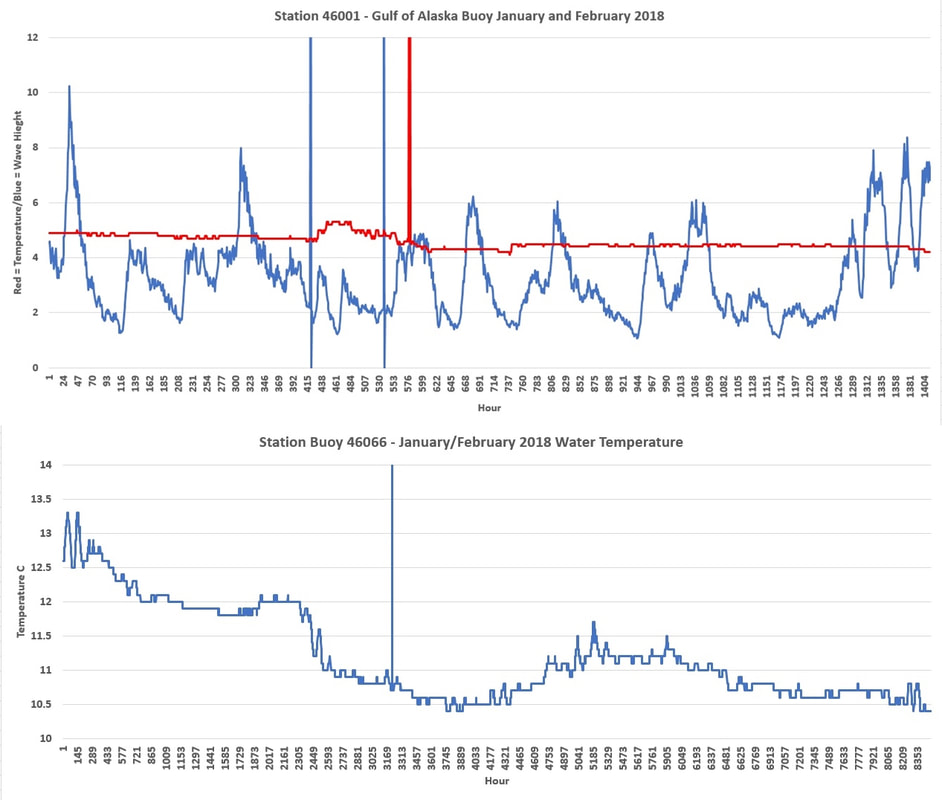 The activity in the Gulf of Alaska is not a typical volcano as we usually think of them. On January 3, 2018, a 3.2 earthquake struck this region at 7.5km. This buoy is 4km above the ocean floor. On January 18th, 2018, a 3.4 magnitude earthquake struck along the ocean floor at 4.7km and I identified this time with the first blue line. This earthquake opened up the ocean floor and allowed cold sea water and magma to interact and is displayed by the lower wave height and increased heat that followed. On January 23, 2018, less than 48 hours later, and is demonstrated by the second blue line, a large 7.9 magnitude struck due to the rising pressure that the incoming sea water was creating. We then observe the surface temperature spike and the wave heights increase less than 48 hours later. Researching this buoy demonstrated no alterations in temperatures of this magnitude in the historical records. 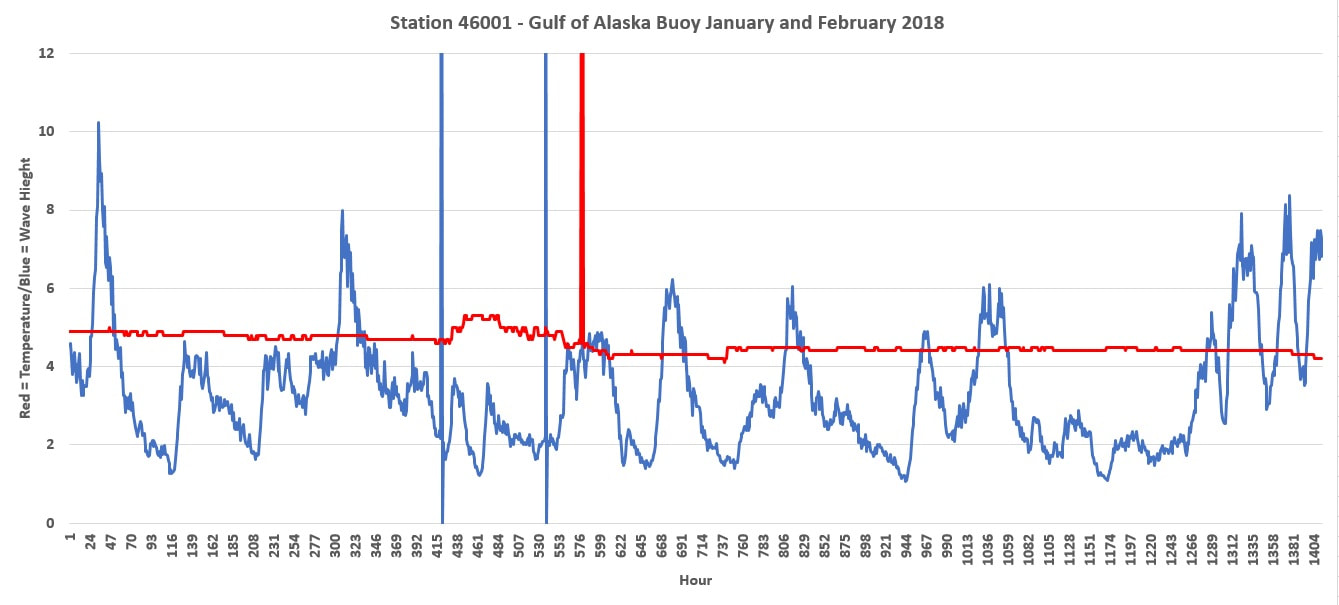 Searching Earthquakes 3.0 and greater, 36km maximum depth in this region of the Gulf of Alaska. There have been more 3.0 level earthquakes in this region in less than 3 months than has been experienced in 26 years. From 1970 to 1996 there were 2,084 earthquakes in this top image, in the bottom image we have had 2,090 since January 1. Prior to this year the maximum was 394 in 2012. 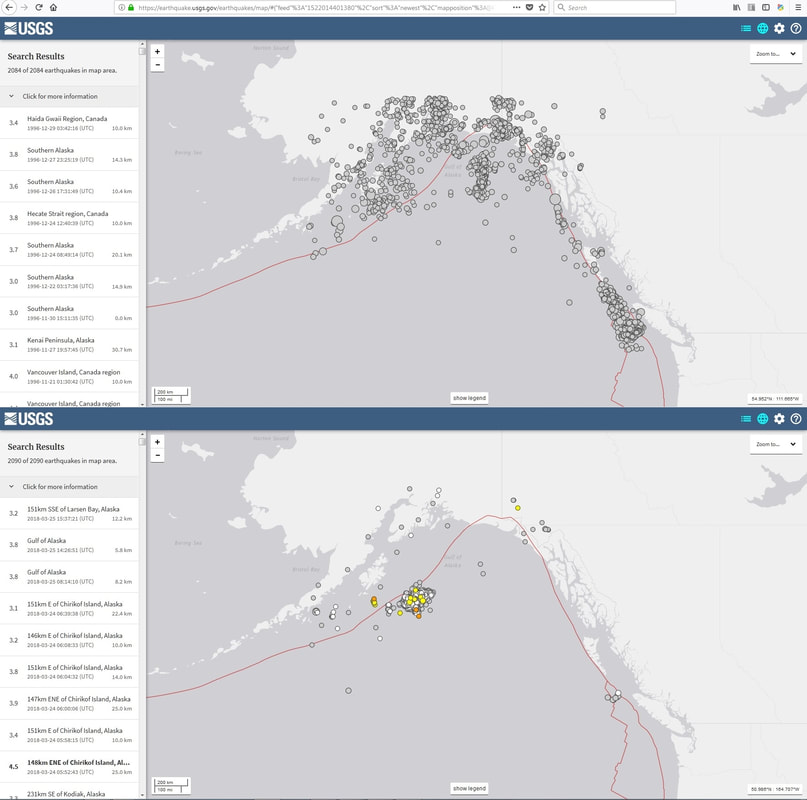 In the following image is the surface water temperatures in the Gulf of Alaska, all other buoys are demonstrating the same rise in surface water temperatures since 2012. This is also the same time frame when subterranean aquifers began pulsing heat into the territorial waters, a sign of the aquifers coming to thermal equilibrium with the bedrock. Now the seas are demonstrating the same rise. 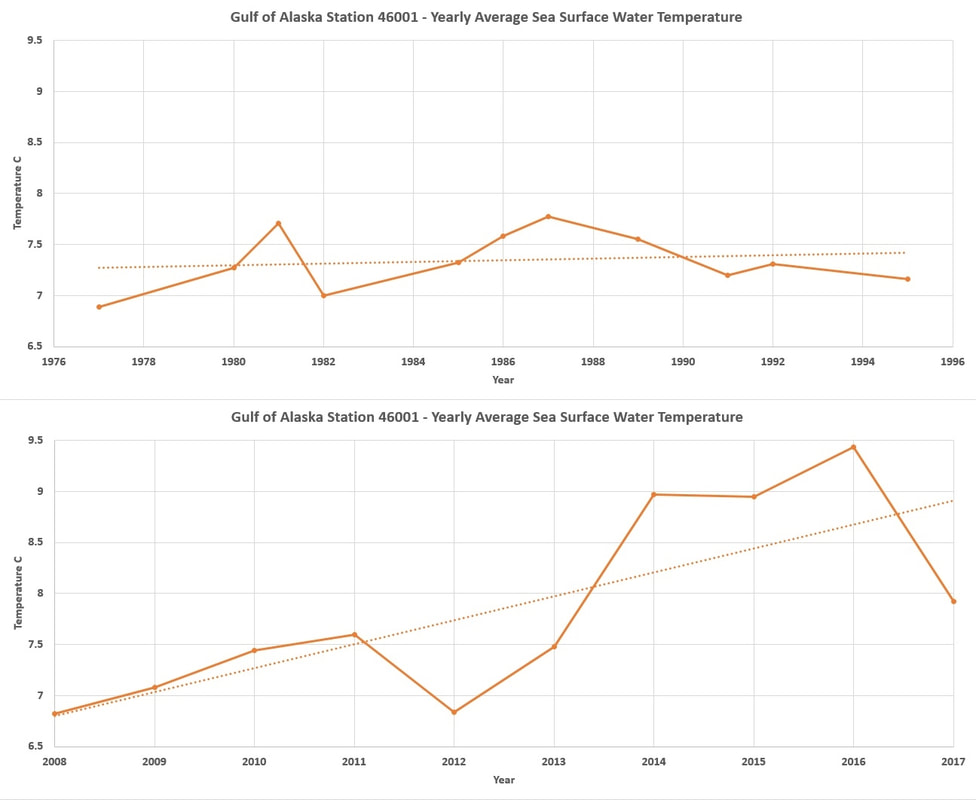 Researching Buoy archives has revealed a mass amount of understanding. For example, here is Station 44011 located out in the North Atlantic in the google map images. Using the historical data on this location reveals massive amounts of energy rising to the surface from geothermal sources when compared to 2017 and 2016. This energy will increase cloud cover and precipitation over Europe short term. http://www.ndbc.noaa.gov/ 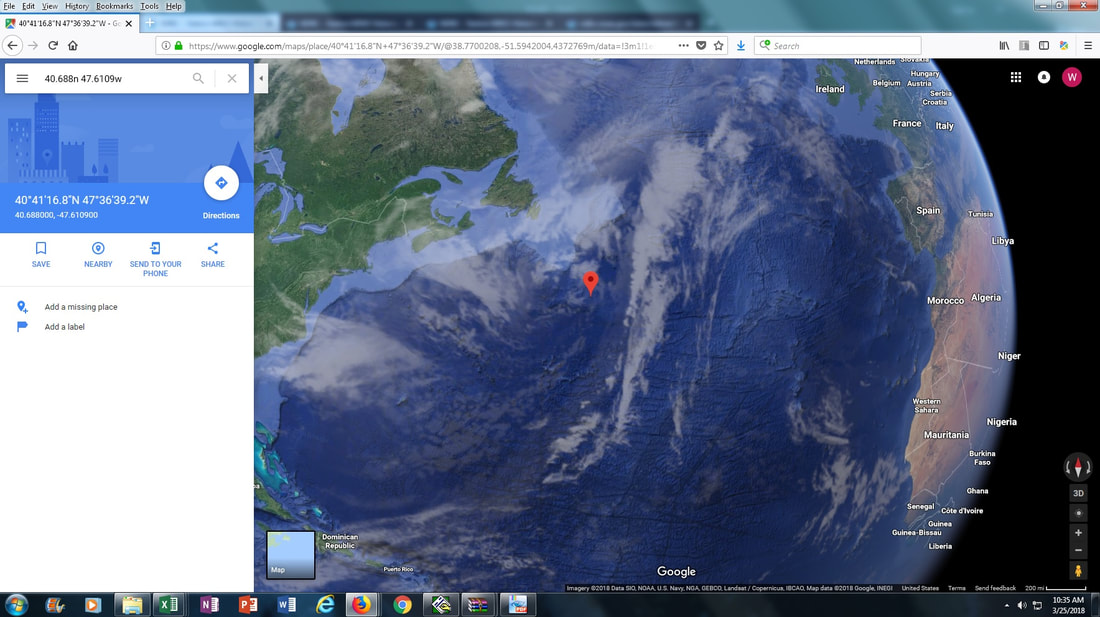 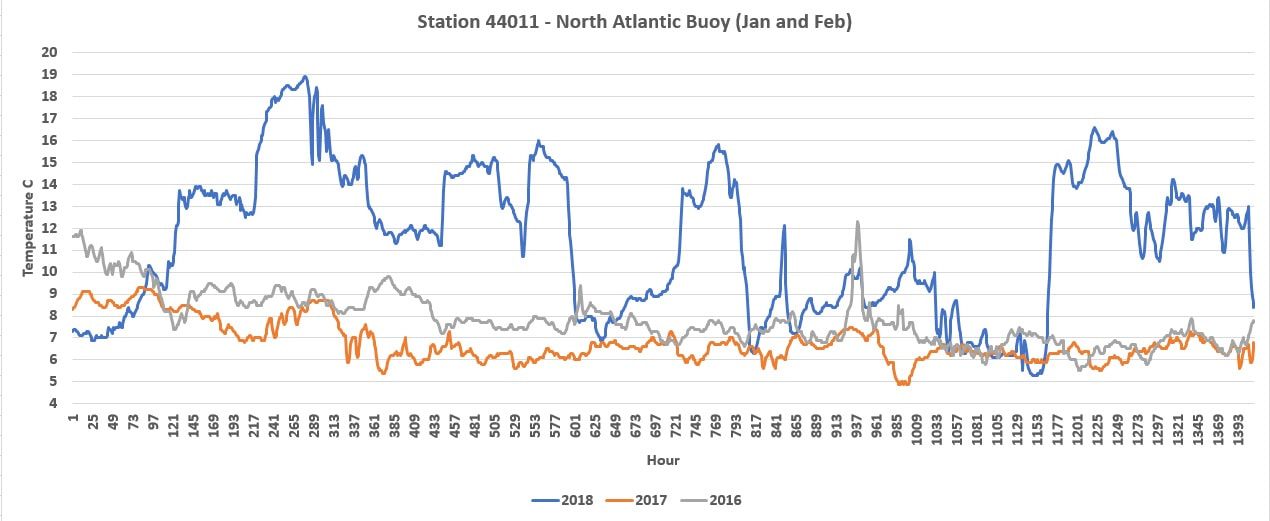 On January 23, 2018 a large 7.9 magnitude deep sea earthquake occurred. Since this time there has been numerous earthquakes in the region. Because volcanic eruptions are associated with these events and the increase in activity in this region, further research was obtained. 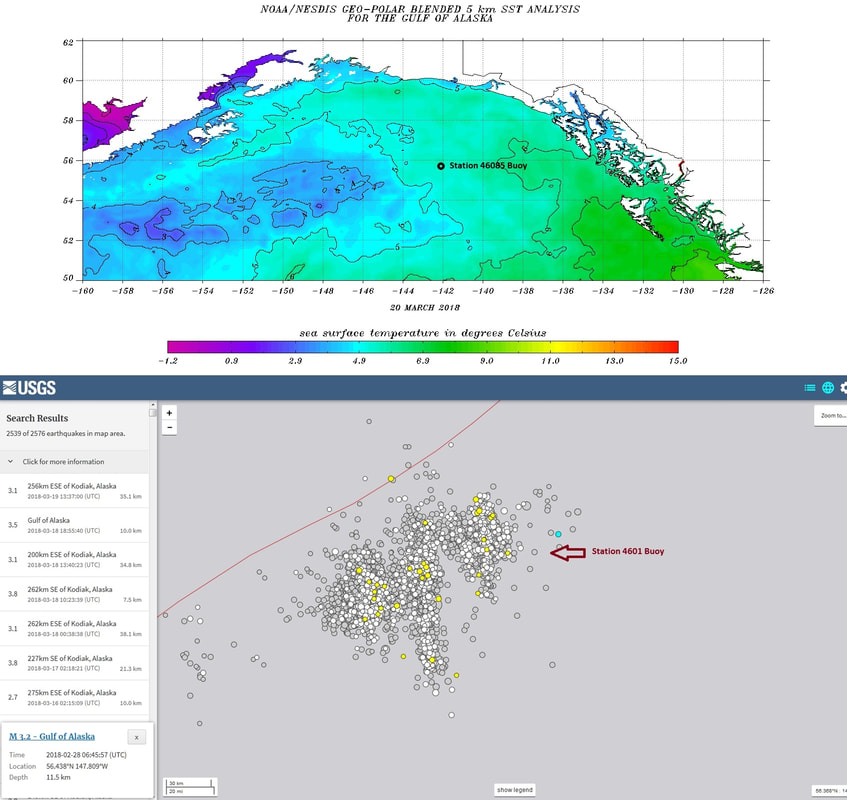 The NOAA National Buoy Center had station 46001 buoy nearly directly above this location and on January 25th the temperatures rose for more than 2 hours reaching 15.5C, 60F above normal. Another buoy, station 46085, demonstrates a continual resistance to cooling maintaining a temperature nearly 1C above last years average. 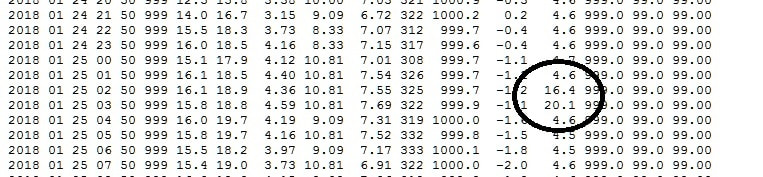 Water will naturally evaporate at a greater rate when warmed, and this has increased the water vapor and clouds in the atmosphere resulting in surface cooling and a rise in precipitation. The jet streams then move this across the continental plate. As the spring melt occurs we will see a rise in flooding as this snow pack along these routes melts releasing even more water vapor into the atmosphere.
|
Archives
September 2019
Categories |
 RSS Feed