|
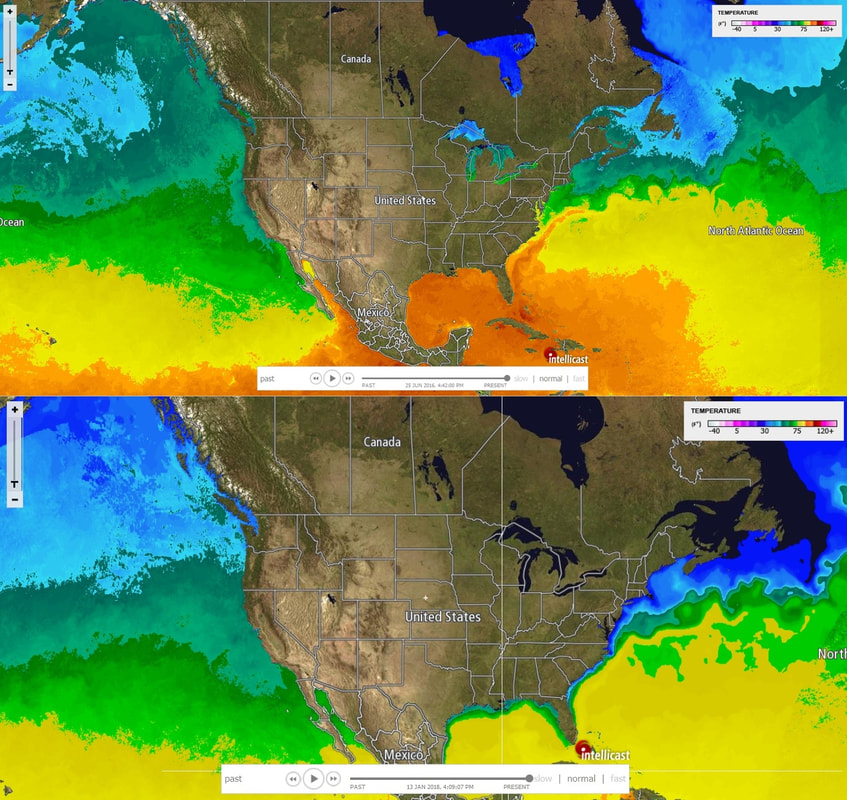
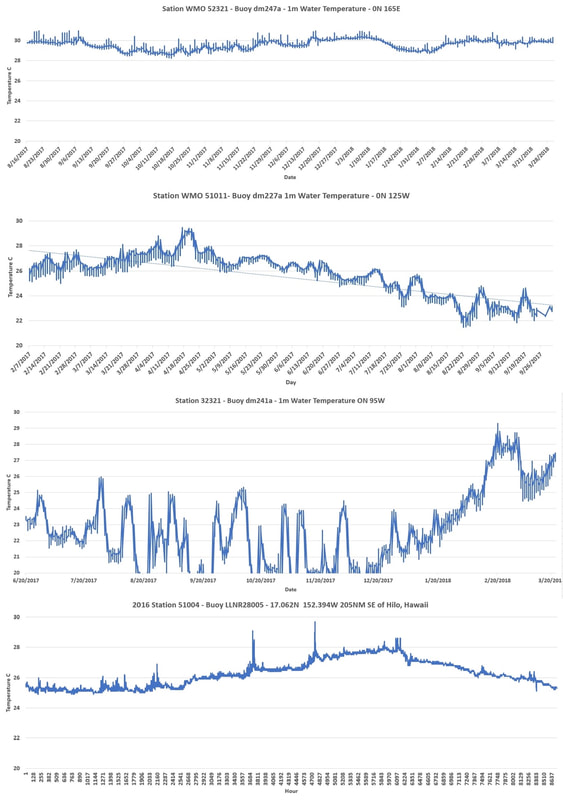
Just assembled this image of graphs so we can observe the impact that the continental plates and land masses, including Islands and ridges have on ocean temperatures. This in turn drives our weather. The top 3 graphs are the equator in the Pacific, top is off the continental plate of Australia, the next is in the center of the Pacific away from plate boundaries, the third is along the North America Coast. They were just deployed last year so historical data is limited. Overall temperature gradients are identical in all 4 graphs. Deployment dates and technical difficulties on one alters the time frames but overlapping times demonstrates a vast difference. The directional flow of our world is from west to east, and so is the heat, as well as the cooling. As the heat flows away from Australia it is dissipated by mass, and the cooling in the third graph demonstrates the influence of the axial tilt, directional flow and elliptical orbit has as the southern hemisphere enters into winter having a greater impact than the northern hemispheres summer as the Earth travels further away from the sun. The last graph is Hawaii 690 miles further north that demonstrates heat permeating from this region where volcanic activity is common.  This bleeding effect of both heating and cooling is demonstrated in the ocean temperature differentiators between the coastal waters in the image above. During the summer in the upper image the heat is flowing east into the Atlantic while ocean temperatures along the Pacific remain much cooler. During the winter, in the lower image, the opposite occurs cooling the Atlantic.
0 Comments
Leave a Reply. |
Archives
September 2019
Categories |

 RSS Feed